What do tokens per second ranges in provisioned throughput mean?
This article describes how and why Databricks measures tokens per second for provisioned throughput workloads for Foundation Model APIs.
Performance for large language models (LLMs) is often measured in terms of tokens per second. When configuring production model serving endpoints, it’s important to consider the number of requests your application sends to the endpoint. Doing so helps you understand if your endpoint needs to be configured to scale so as to not impact latency.
When configuring the scale-out ranges for endpoints deployed with provisioned throughput, Databricks found it easier to reason about the inputs going into your system using tokens.
What are tokens?
LLMs read and generate text in terms of what is called a token. Tokens can be words or sub-words, and the exact rules for splitting text into tokens vary from model to model. For instance, you can use online tools to see how Llama’s tokenizer converts words to tokens.
The following diagram shows an example of how the Llama tokenizer breaks up text:

Why measure LLM performance in terms of tokens per second?
Traditionally, serving endpoints are configured based on the number of concurrent requests per second (RPS). However, an LLM inference request takes a different amount of time based on how many tokens are passed in and how many it generates, which can be imbalanced across requests. Therefore, deciding how much scale out your endpoint needs really requires measuring endpoint scale in terms of the content of your request - tokens.
Different use cases feature different input and output token ratios:
- Varying lengths of input contexts: While some requests might involve only a few input tokens, for example a short question, others may involve hundreds or even thousands of tokens, like a long document for summarization. This variability makes configuring a serving endpoint based only on RPS challenging since it does not account for the varying processing demands of the different requests.
- Varying lengths of output depending on use case: Different use cases for LLMs can lead to vastly different output token lengths. Generating output tokens is the most time intensive part of LLM inference, so this can dramatically impact throughput. For example, summarization involves shorter, pithier responses, but text generation, like writing articles or product descriptions, can generate much longer answers.
How do I select the tokens per second range for my endpoint?
Provisioned throughput serving endpoints are configured in terms of a range of tokens per second that you can send to the endpoint. The endpoint scales up and down to handle the load of your production application. You are charged per hour based on the range of tokens per second your endpoint is scaled to.
The best way to know what tokens per second range on your provisioned throughput serving endpoint works for your use case is to perform a load test with a representative dataset. See Conduct your own LLM endpoint benchmarking.
There are two important factors to consider:
- How Databricks measures tokens per second performance of the LLM.
- How autoscaling works.
How Databricks measures tokens per second performance of the LLM
Databricks benchmarks endpoints against a workload representing summarization tasks that are common for retrieval-augmented generation use cases. Specifically, the workload consists of:
- 2048 input tokens
- 256 output tokens
The token ranges displayed combine input and output token throughput and, by default, optimize for balancing throughput and latency.
Databricks benchmarks that users can send that many tokens per second concurrently to the endpoint at a batch size of 1 per request. This simulates multiple requests hitting the endpoint at the same time, which more accurately represents how you would actually use the endpoint in production.
- For example, if a provisioned throughput serving endpoint has a set rate of 2304 tokens per second (2048 + 256), then a single request with an input of 2048 tokens and an expected output of 256 tokens is expected to take about one second to run.
- Similarly, if the rate is set to 5600, you can expect a single request, with the input and output token counts above, to take about 0.5 seconds to run –that is the endpoint can process two similar requests in about one second.
If your workload varies from the above, you can expect the latency to vary with respect to the listed provisioned throughput rate. As stated previously, generating more output tokens is more time-intensive than including more input tokens. If you are performing batch inference and want to estimate the amount of time it will take to complete, you can calculate the average number of input and output tokens and compare to the Databricks benchmark workload above.
- For example, if you have 1000 rows, with an average input token count of 3000 and an average output token count of 500, and a provisioned throughput of 3500 tokens per second, it might take longer than 1000 seconds total (one second per row) due to your average token counts being greater than the Databricks benchmark.
- Similarly, if you have 1000 rows, an average input of 1500 tokens, an average output of 100 tokens, and a provisioned throughput of 1600 tokens per second, it might take fewer than 1000 seconds total (one second per row) due to your average token counts being less than the Databricks benchmark.
To estimate the ideal provisioned throughput needed to complete your batch inference workload, you can use the notebook in the Perform batch LLM inference using ai_query
How autoscaling works
Model Serving features a rapid autoscaling system that scales the underlying compute to meet the tokens per second demand of your application. Databricks scales up provisioned throughput in chunks of tokens per second, so you are charged for additional units of provisioned throughput only when you’re using them.
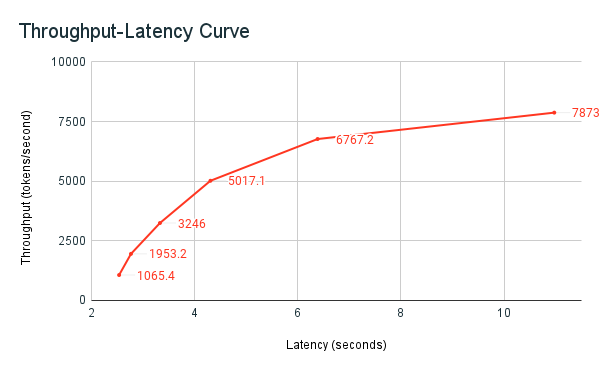
The following throughput-latency graph shows a tested provisioned throughput endpoint with an increasing number of parallel requests. The first point represents 1 request, the second, 2 parallel requests, the third, 4 parallel requests, and so on. As the number of requests increases, and in turn the tokens per second demand, you see that the provisioned throughput increases as well. This increase indicates that autoscaling increases the compute available. However, you might begin to see that the throughput begins to plateau, reaching a limit of ~8000 tokens per second as more parallel requests are made. Total latency increases as more requests have to wait in queue before being processed because the allotted compute is being used simultaneously.
Note
You can keep the throughput consistent by turning off scale-to-zero and configuring a minimum throughput on the serving endpoint. Doing so avoids the need to wait for the endpoint to scale up.

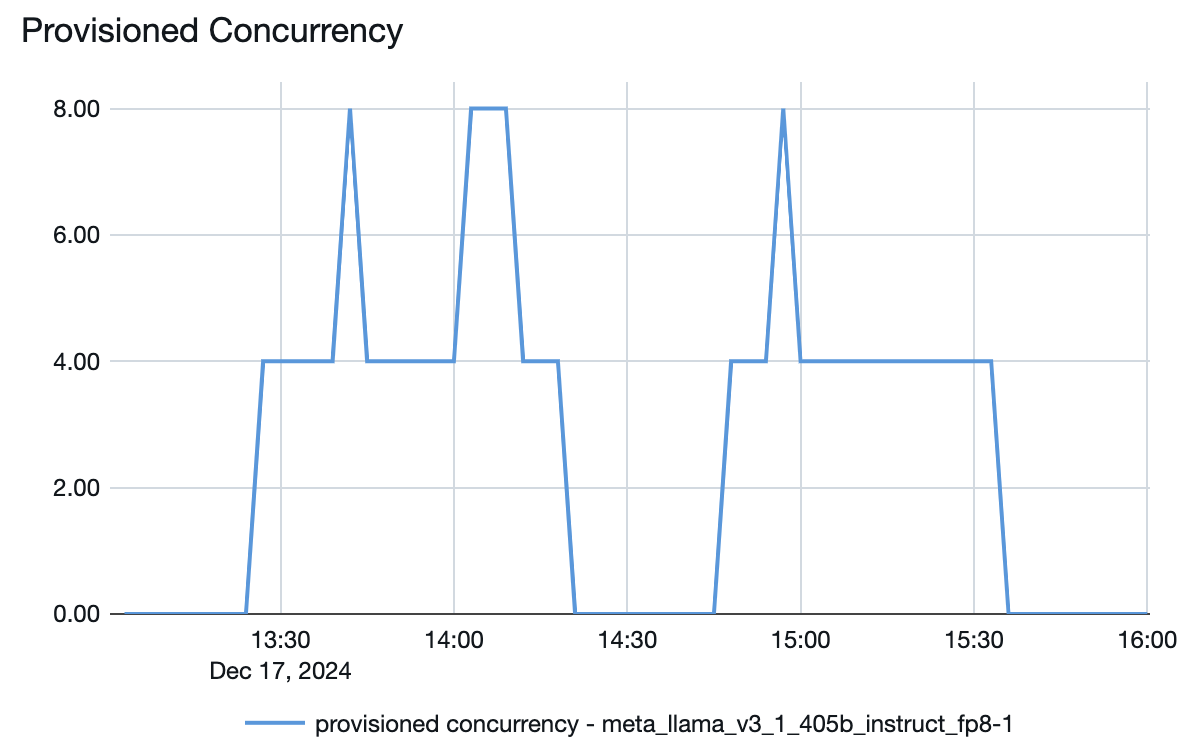
You can also see from the model serving endpoint how resources are spun up or down depending on the demand:

