Run URL-based load tests with Azure DevOps
Azure Test Plans
Note
While Azure DevOps cloud-based load testing service is deprecated, Azure Load Testing Preview is available. Azure Load Testing Preview is a fully managed load testing service that enables you to use existing Apache JMeter scripts to generate high-scale load. To learn more, see What is Azure Load Testing Preview?. To learn more about the deprecation of Azure DevOps load testing and other, alternative services see Changes to load test functionality in Visual Studio and cloud load testing in Azure DevOps.
You can run a load test on your web app or site directly using Azure DevOps.
Prepare your environment
You will need a Visual Studio Enterprise subscription (monthly, annual, or MSDN) to run URL-based load tests.
Create your Azure DevOps subscription if you don't have one already.
Run a URL-based load test
Sign into Azure DevOps.
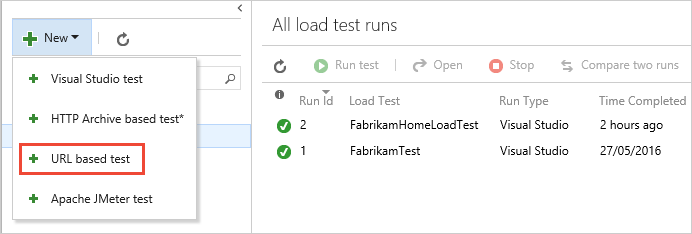
Go to Azure Test Plans (see Web portal navigation), open the Load test page, and choose URL based test from the + New menu.
Type a name for the load test, then enter the URL you want to test in the center column and in the details pane on the right. For a simple load test, leave the HTTP method set to GET.
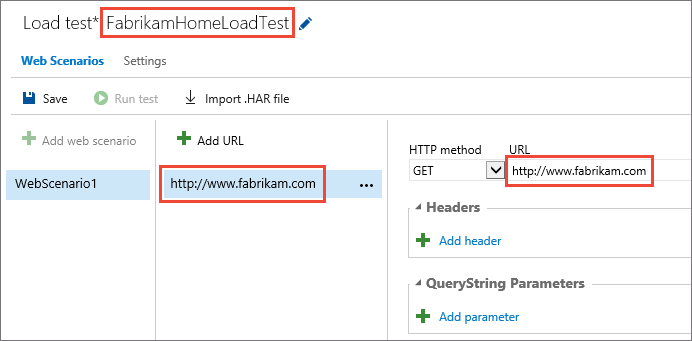
You can add multiple URLs and select the method for each one, such as POST or PUT. You can also add headers and querystring values if you need to send these as part of the request. The URL Load Test accesses each of these URLs multiple times using the parameters you specify, and records the results.
Open the Settings page. Here you can change the parameters of the test such as the duration, load pattern, number of users, and more. To run the test near to your users, select a Load location. Then choose Save.
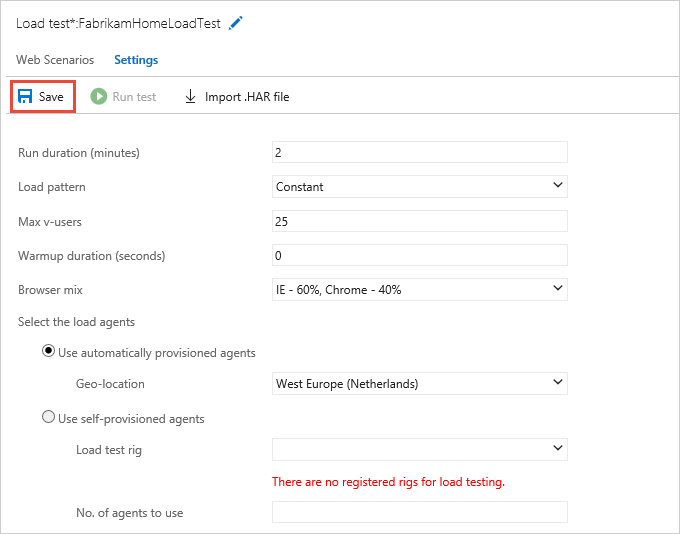
When you have set up all the URLs and parameters for your test, start it by choosing Run test.

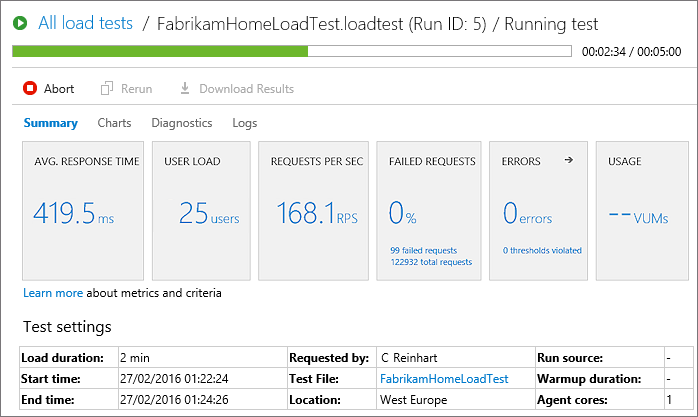
As the test runs, you see live information about the progress of the test. You can stop the test by using the Abort link on the toolbar.
View the results of the load test
When your test is done, look at the results to see how well your app performed. For example, you can see an overview of your app's performance in the Summary page. This page shows all of the main metrics such as average response time, user load, requests per second, failed requests, any errors that might have occurred, and test usage.
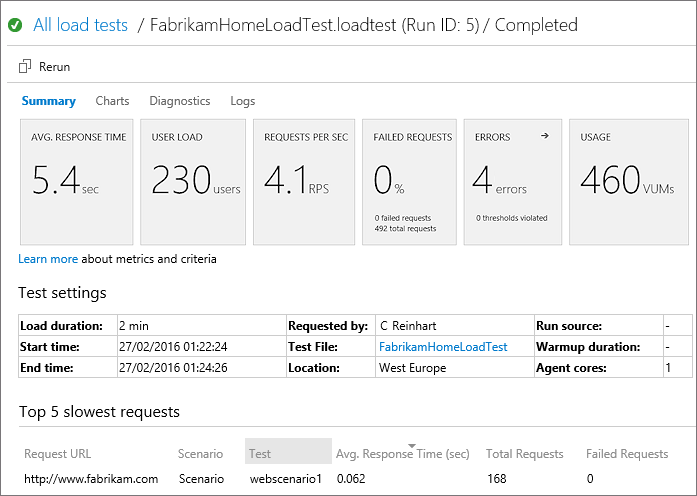
The lower section of the Summary page shows the settings used for the test, and details of the five slowest requests during the test. If there are any transaction tests, the page will also show the five slowest of these. Use the
 icon above a column to sort the list based on the contents of that column.
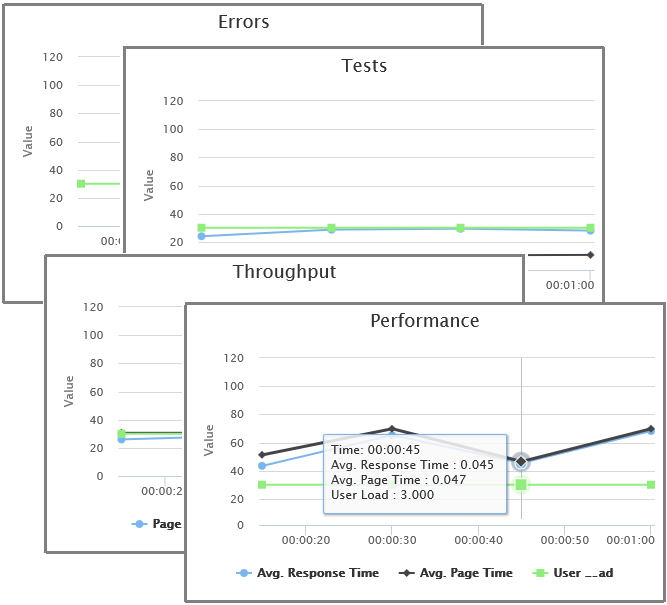
Open the Charts page to see a graphical representation of the test results over time. The charts show the average performance, throughput, errors, and the results of each test request. Hover your mouse pointer over a chart to see more details.
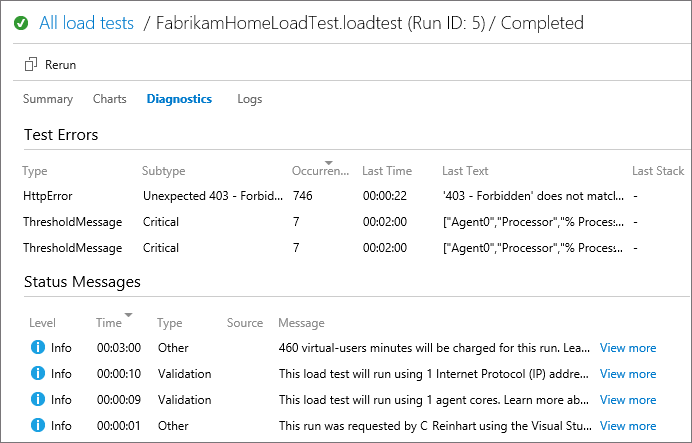
Open the Diagnostics page to see detailed information such as a list of errors and status messages.
You can also use the
 icon in the Errors section of the Summary page to go directly to the
Diagnostics page.
Open the Logs page to see a list of test runs. Choose the link in the Attachment column to download the detailed log as a text file.

To run the same test again, choose Rerun.

Key metrics
Response Time. The time it takes for your app to respond to requests is one of the key metrics for measuring app performance. Most apps perform well when a single user is accessing them, but the response time can increase dramatically when the app is under load. This can happen if resources such as CPU, database or other services are at peak capacity, resulting in longer response times.
User Load. The peak user load encountered during the load test run.
Failed Requests. The number of requests that failed, either because the app did not respond or due to other issues such as connectivity errors. Your app might start throttling requests when under load by discarding new requests in order to allow existing requests to be processed.