Debugger components
Applies to: ![]() Visual Studio
Visual Studio ![]() Visual Studio for Mac
Visual Studio for Mac
Note
This article applies to Visual Studio 2017. If you're looking for the latest Visual Studio documentation, see Visual Studio documentation. We recommend upgrading to the latest version of Visual Studio. Download it here
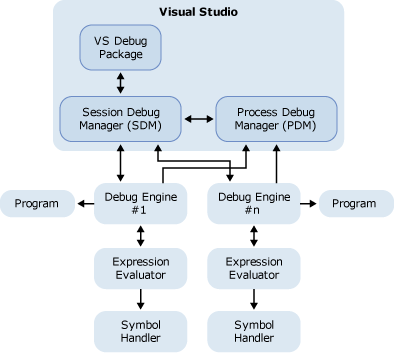
The Visual Studio debugger is implemented as a VSPackage and manages the entire debug session. The debug session comprises the following elements:
Debug Package: The Visual Studio debugger provides the same user interface no matter what is being debugged.
Session debug manager (SDM): Provides a consistent programmatic interface to the Visual Studio Debugger for the management of a variety of debug engines. It is implemented by Visual Studio.
Process debug manager (PDM): Manages, for all running instances of Visual Studio, a list of all programs that can be or are being debugged. It is implemented by Visual Studio.
Debug engine (DE): Is responsible for monitoring a program being debugged, communicating the state of the running program to the SDM and the PDM, and interacting with the expression evaluator and symbol provider to provide real-time analysis of the state of a program's memory and variables. It is implemented by Visual Studio (for the languages it supports) and third-party vendors who want to support their own run time.
Expression evaluator (EE): Provides support for dynamically evaluating variables and expressions supplied by the user when a program has been stopped at a particular point. It is implemented by Visual Studio (for the languages it supports) and third-party vendors who want to support their own languages.
Symbol provider (SP): Also called a symbol handler, maps the debugging symbols of a program to a running instance of the program so that meaningful information can be provided (such as source-code-level debugging and expression evaluation). It is implemented by Visual Studio (for the Common Language Runtime [CLR] symbols and the Program DataBase [PDB] symbol file format) and by third-party vendors who have their own proprietary method of storing debugging information.
The following diagram shows the relationship among these elements of the Visual Studio debugger.

In this section
Debug package Discusses the debug package, which runs in the Visual Studio shell and handles all of the UI.
Process debug manager Provides an overview of the features of the PDM, which is the manager of the processes that can be debugged.
Session debug manager Defines the SDM, which provides a unified view of the debug session to the IDE. The SDM manages the DE.
Debug engine Documents the debugging services that the DE provides.
Operational modes Provides an overview of the three modes in which the IDE can operate: design mode, run mode, and break mode. Transition mechanisms are also discussed.
Expression evaluator Explains the purpose of the EE at run time.
Symbol provider Discusses how, at implementation, the symbol provider evaluates variables and expressions.
Type visualizer and custom viewer Discusses what a type visualizer and custom viewer are and what role the expression evaluator plays in supporting both.
Related sections
Debugger concepts Describes the main debugging architectural concepts.
Debugger contexts Explains how the DE operates simultaneously within code, documentation, and expression evaluation contexts. Describes, for each of the three contexts, the location, position, or evaluation relevant to it.
Debug tasks Contains links to various debugging tasks, such as launching a program and evaluating expressions.