Debug a WebView control in a UWP App
Applies to: ![]() Visual Studio
Visual Studio ![]() Visual Studio for Mac
Visual Studio for Mac
Note
This article applies to Visual Studio 2017. If you're looking for the latest Visual Studio documentation, see Visual Studio documentation. We recommend upgrading to the latest version of Visual Studio. Download it here
To inspect and debug WebView controls in a Windows Runtime app, you can configure Visual Studio to attach the script debugger when you start your app. You have two ways to interact with WebView controls using the debugger:
Open the DOM Explorer for a
WebViewinstance, and inspect DOM elements, investigate CSS style issues, and test dynamically rendered changes to styles.Select the webpage or
iFramedisplayed in theWebViewinstance as a target in the JavaScript Console window, and then interact with the webpage using console commands. The console provides access to the current script execution context.
Attach the debugger (C#, Visual Basic, C++)
In Visual Studio, add a
WebViewcontrol to your Windows Runtime app.In Solution Explorer, open the properties for the project by choosing Properties from the shortcut menu for the project.
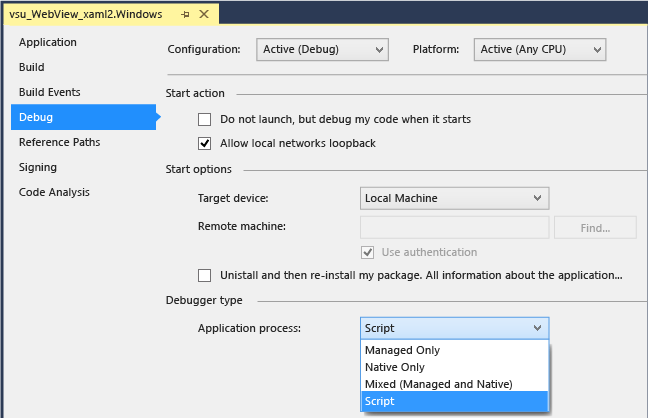
Choose Debug. In the Application process list, choose Script.

(Optional) For non-Express versions of Visual Studio, disable just-in-time (JIT) debugging by choosing Tools > Options > Debugging > Just-In-Time, and then disabling JIT debugging for Script.
Note
By disabling JIT debugging, you can hide dialog boxes for unhandled exceptions that occur on some webpages. In Visual Studio Express, JIT debugging is always disabled.
Press F5 to start debugging.
Use the DOM Explorer to inspect and debug a WebView control
(C#, Visual Basic, C++) Attach the script debugger to your app. See the first section for instructions.
If you haven't already, add a
WebViewcontrol to your app and press F5 to start debugging.Navigate to the page containing the
Webviewcontrol(s).Open the DOM Explorer window for the
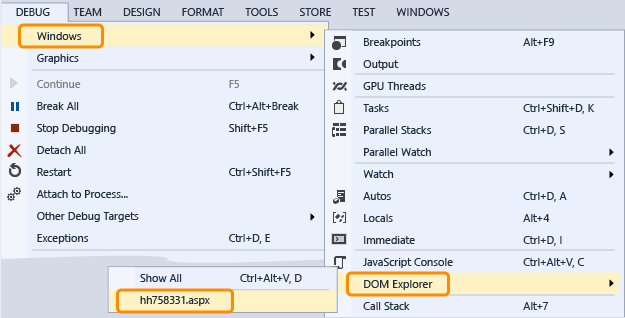
WebViewcontrol by choosing Debug, Windows, DOM Explorer, and then choose the URL of theWebViewthat you want to inspect.
The DOM Explorer associated with the
WebViewappears as a new tab in Visual Studio.View and modify live DOM elements and CSS styles as described in Debug CSS styles using DOM Explorer.
Use the JavaScript Console window to inspect and debug a WebView control
(C#, Visual Basic, C++) Attach the script debugger to your app. See the first section for instructions.
If you haven't already, add a
WebViewcontrol to your app and press F5 to start debugging.Open the JavaScript Console window for the
WebViewcontrol by choosing Debug, Windows, JavaScript Console.The JavaScript Console window appears.
Navigate to the page containing the
Webviewcontrol(s).In the Console window, select the webpage or an
iFramedisplayed by theWebViewcontrol in the Target list.
Note
Using the console, you can interact with a single
WebView,iFrame, share contract, or web worker at a time. Each element requires a separate instance of the web platform host (WWAHost.exe). You can interact with one host at a time.View and modify variables in your app or use console commands, as described in QuickStart: Debug JavaScript and JavaScript Console commands.