@scott , Welcome to Microsoft Q&A! Thanks for posting this question.
On which region have you hosted your WebApp?
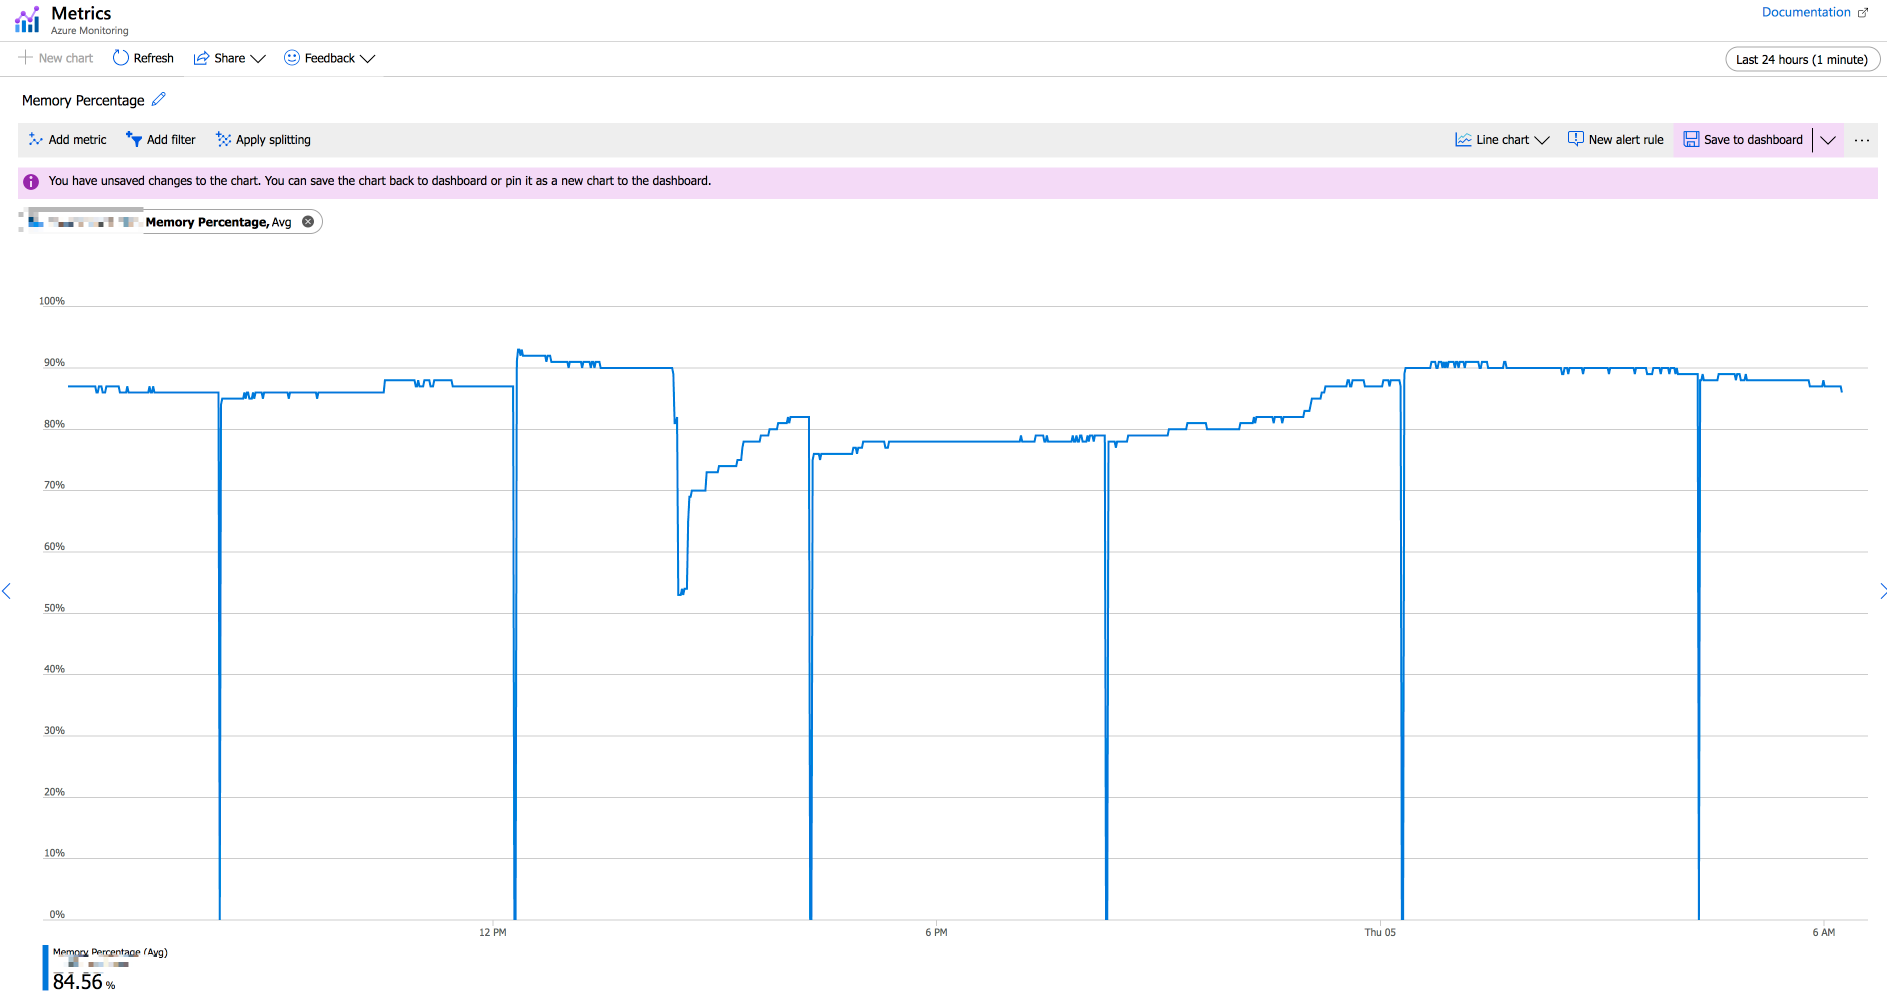
Has this been the case since the app was provisioned or you recently started to see this memory leak? If it's the latter, were there any changes performed prior to this issue?
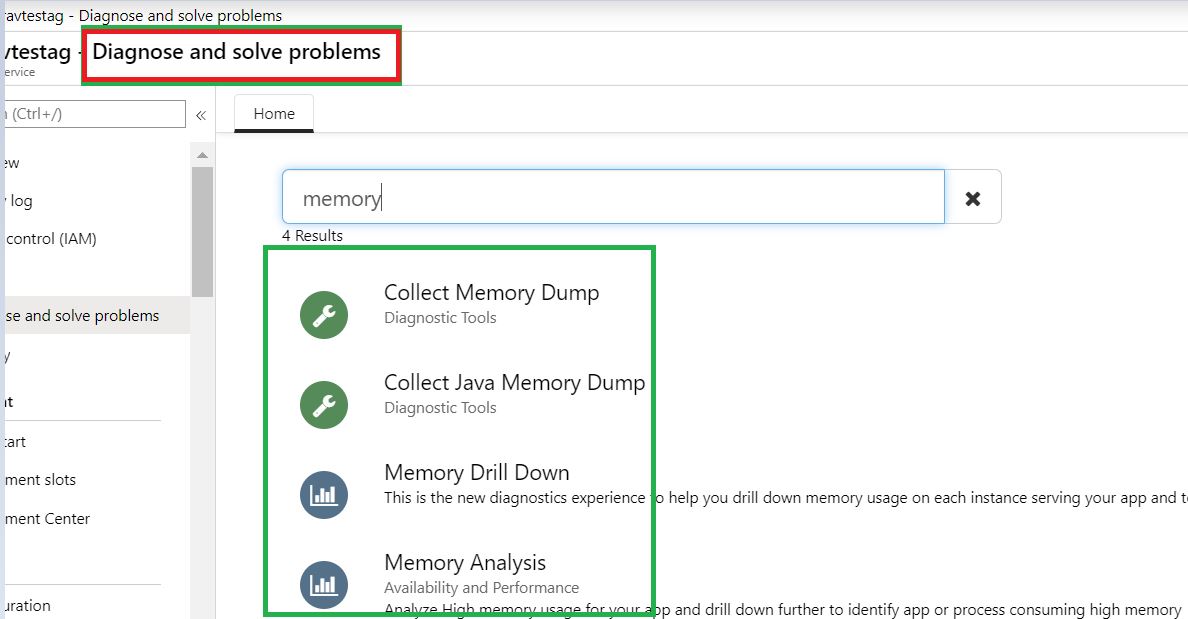
Firstly, run the "Memory usage" diagnostic, to do this, use the Diagnose and solve problems blade in the Azure portal.
- In the Azure portal, open the app in App Services.
- Select Diagnose and solve problems.

In some high memory-consumption scenarios, your app might truly require more computing resources. In that case, consider scaling to a higher service tier so the application gets all the resources it needs. Other times, a bug in the code might cause a memory leak. A coding practice also might increase memory consumption. Getting insight into what's triggering high memory consumption is a two-part process: create a process dump, and then analyze the process dump (as highlighted in the screenshot).
Furthermore, you could also review the Service Health and Resource Health notifications - The ‘Service Health’ - Service issues view shows any ongoing problems in Azure services that are impacting your resources. You can understand when the issue began, and what services and regions are impacted. You can also read the most recent update to understand what Azure is doing to resolve the issue.
Where as the Resource health helps you diagnose and get support when an Azure issue impacts your resources. It informs you about the current and past health of your resources and helps you mitigate issues.

