Entity Framework Core
A lightweight, extensible, open-source, and cross-platform version of the Entity Framework data access technology.
743 questions
This browser is no longer supported.
Upgrade to Microsoft Edge to take advantage of the latest features, security updates, and technical support.
' cx='32' cy='32' r='32' /%3E%3Ctext x='50%25' y='55%25' dominant-baseline='middle' text-anchor='middle' fill='%23FFF' %3EJT%3C/text%3E%3C/svg%3E)
Goal:
The name of the tool in order review the code as a sql code when you apply the input linq code C#
Problem:
What is the name of the tool? Can you find it at Visual studio 2019 or do you need an additional tool that need to be downloaded?
Info:
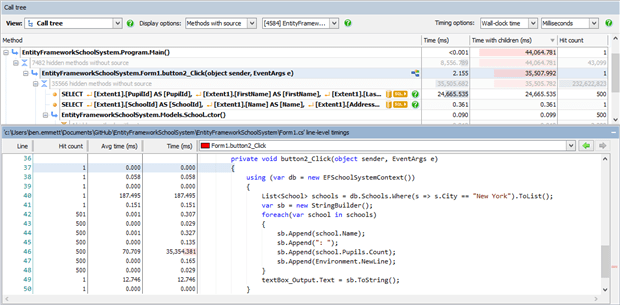
The picture is from this page (https://www.red-gate.com/simple-talk/dotnet/net-tools/entity-framework-performance-and-what-you-can-do-about-it/)
Thank you!
' cx='32' cy='32' r='32' /%3E%3Ctext x='50%25' y='55%25' dominant-baseline='middle' text-anchor='middle' fill='%23FFF' %3EWG%3C/text%3E%3C/svg%3E)
It mentions just above the picture, it's ANTS profiler, a product from RedGate : https://www.red-gate.com/products/dotnet-development/ants-performance-profiler/ (It's not free, but does have a 14 day trial).
Depending on what you want to profile, Visual Studio does have it's own Profiler : https://zcusa.951200.xyz/en-us/visualstudio/profiling/profiling-feature-tour?view=vs-2019
Specifically to your question :
review the code as a sql code when you apply the input linq code C#
SQL Server Studio (Free) has a profiler : https://zcusa.951200.xyz/en-us/sql/tools/sql-server-profiler/start-sql-server-profiler?view=sql-server-ver15. It won't tie your code to the SQL persay, but it's good as you step through code in Visual Studio debugger, you can have the profiler up and view SQL code as it's run. I use it a lot when writing Entity Framework code to check how EF is translating my LINQ to SQL.