Aligning Multiple Series with Categorical Values
Binding Categorical Data Overview
Binding chart to the data source with categorical values is pretty simple and usually requires just one line of code:
| Chart1.Series["Series1"].Points.DataBind(mySource, "ProductName", "Sales"); |
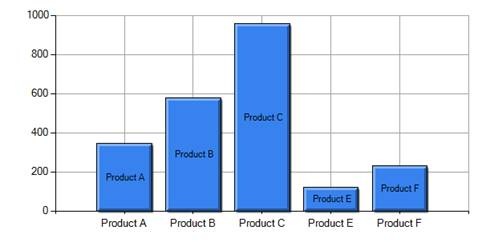
It is important to understand that after DataBind method creates series DataPoint objects, their XValue property will always be set to zero and category is saved in the AxisLabel property. Position of each data point along the category axis is determined using the index of the object in Series.Points collection. Below is an example of what your chart may look like:
Alignment of Multiple Series
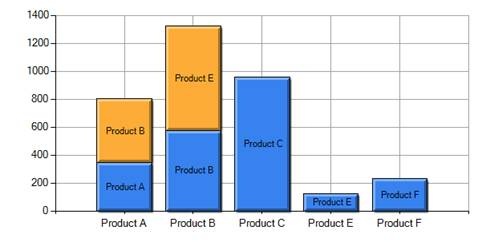
When you bind multiple series with categorical values you may run into some un-expected results based on how you prepare your data source. For example, let's imagine that our two chart series are bound to this data:
| Series 1 | Series 2 |
| Product A = 320 | Product B = 420 |
| Product B = 580 | Product E = 830 |
| Product C = 980 | |
| Product E = 100 | |
| Product F = 220 |
As you can notice, we have less categories for the second series and their order does not match categories from the first series. If we try binding chart to this data we will end up with the chart shown below. Chart uses index of the data point to position them along the axis and we end up with orange series points in the wrong position. I added data point labels so that it would easier to see the issue.
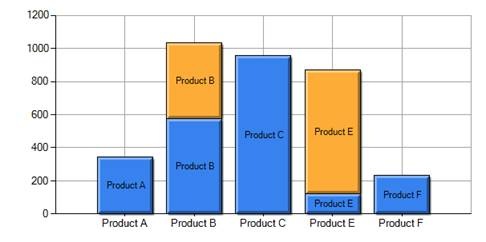
In order to resolve this we can modify our data source to contain same number of categories in the same order like this:
| Series 1 | Series 2 |
| Product A = 320 | Product A = Null |
| Product B = 580 | Product B = 420 |
| Product C = 980 | Product C = Null |
| Product E = 100 | Product E = 830 |
| Product F = 220 | Product F = Null |
Simpler approach is just to make a single call to Chart.AlignDataPointsByAxisLabel method which will automatically align the two series by inserting empty points and the end result will look like this:
Hope this helps!
Alex.
Comments
- Anonymous
March 26, 2009
PingBack from http://www.anith.com/?p=23332 - Anonymous
June 29, 2010
The comment has been removed - Anonymous
August 12, 2010
hi sir,pls, how i have to do with 4 hashtable for 4 series? (powershell)Mfgarnold - Anonymous
April 25, 2011
Bob, for that you must have the datasource looking like thisSeries 1 Series 2Product A = 320 Product A = NullProduct B = Null Product B = 420Product C = 980 Product C = NullProduct D = 980 Product D = NullProduct E = 100 Product E = 830Product F = Null Product F = Null - Anonymous
July 07, 2011
The comment has been removed - Anonymous
March 27, 2013
Hello,I am Using the win form,I exactly want you ve written here but without database or databinding,I directly assing the values.What i need is to allign multiple series, but i dont ve codePls write an example code.Thank you. - Anonymous
April 30, 2013
Hey Alex!Could you post the source code?TYhanks! - Anonymous
May 02, 2013
Not working.. can you post example pls, thanks - Anonymous
May 12, 2013
I am using four series, of which two are STRING lists and two are DOUBLE lists. On using align by axis label, the second pair of STRING & DOUBLES disappears.The x-values (strings) overlap, so I was expecting an overlapping graph. Instead only the first series of double values is plotted with respect to strings on x-axis. Any idea why this is happening? Thanks for your help. - Anonymous
May 29, 2013
I don't know how thanks... my problem is sloved (with this method Chart.AlignDataPointsByAxisLabel) - Anonymous
November 02, 2013
I just spent the last 5 hours trying to solve this...I had tried everything you can imagine. THANKS! - Anonymous
July 02, 2014
What would it take for you to actually post some working code? - Anonymous
June 29, 2015
mechart.AlignDataPointsByAxisLabel();