SharePoint ULS - Performance Event Filter
Update 6/29: The Filter now contains Event Id's for larger file upload trouble shooting.
I've found over the years that the SharePoint ULS logs are an invaluable resource for trouble shooting SharePoint issues. The problem is, the ULS logs are also painful to read and filter through. Even if your farm is small with a few servers and less than 1000 users, you ULS logs can still have thousands or even millions of rows. A larger scale farm, with many servers and over 50k users can have over a million rows or more, in a 30 minute span using merge-splogfile. Filling up the logs with normal activity and then try to figure out what could be causing a performance impact is not easy and there's probably situation that is requiring you to find the root cause.
To help in this process and hopefully make it a little bit less painful, I've created a ULS Log Viewer - Performance Filter. I've tracked down the ULS log event id's for performance related events and entered them into 1 filter that you can load. I've tested this filter with SharePoint 2010, 2013, and 2016.
Here is the download link: ULS Performance Filter
The default ULS log filter folder location is “C:\Users\%UserName%\Documents\MyUlsViewer”.
- Steps to use the filter:
1) Download the Performance Filter.ulsfilter
2) Open ULS Log Viewer
3) Open the ULS log to be reviewed
4) Select Edit, Modify Filter.
5) In the Filter window, click Load
.
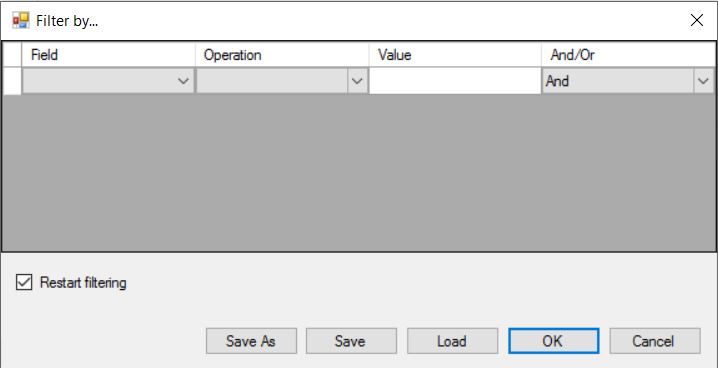
6) Open Performance Filters.ulsfilter from the saved location and hit Ok.
All Performance related event id’s that are logged in ULS log will be surfaced.
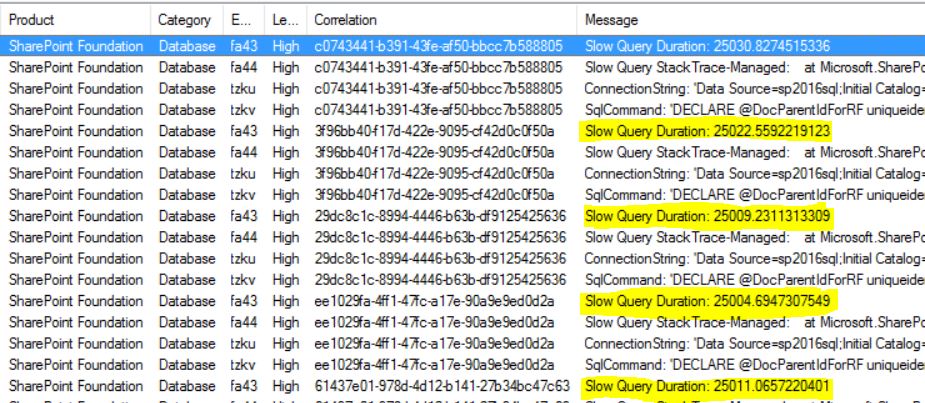
Note: The query duration time is in millisecond and you can divide all numbers by 1000 to get the actual time in seconds.
Looking further into the data, you can open the query and get some insight as to where the Slow Query is originating. In our case it appears to be a list.
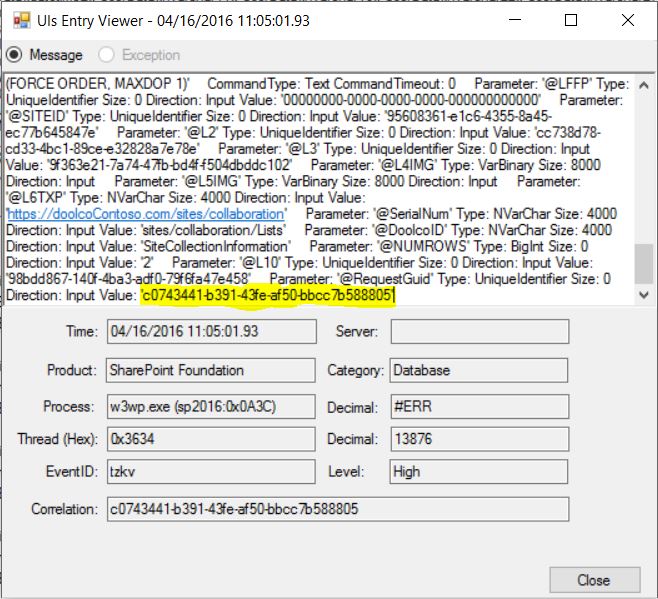
Fortunately we see the site collection url in the body of the query. Unfortunately we only have the list GUID in at the bottom. With some PowerShell or a fancy URL construction, we can determine where this query is executing.
Unfortunately this isn't perfect and there are some know challenges:
1) The filter does not sort on the filtered results. It shows all "Slow Query" events for entire log.
2) No option to sort by the slowest query or longest query time.
3) All Query execution times are in milliseconds. (Example: 25011.034852 = 25 seconds)