Energy Flows
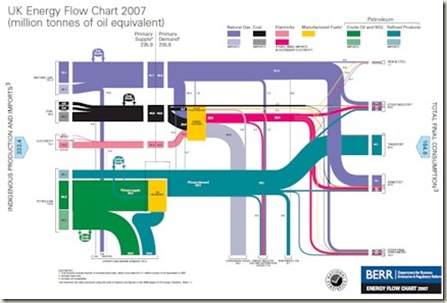
The benefits to Dynamic Work are economic, ecological and social. One area of business that affects all three is transportation. Commuting and business travel cost money, cost carbon (and other environmental impacts) and cost time away from family. Showing both the scale and connection of the costs of transport in the overall economy is a truly stunning diagram by the Department for Business & Enterprise Regulatory Reform.
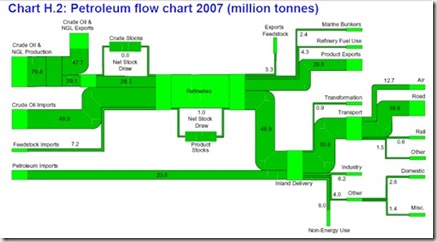
The left hand side shows the relative proportions of energy inputs to the UK economy with petroleum almost as large as the others combined. These are then ‘flowed’ to their respective uses with transport dominating in size. We can all switch-off lights at home and turn down the thermostats, but unless we change our commuting ways, we are not going to have much of a dent in our petroleum consumption. The more detailed chart below focusing just on the petroleum element underscores this with ‘Road’ usage of petroleum being more than all other uses combined. Lots of people are targeting the environmental costs of air travel, and this is certainly a cost, but it is a fraction of the petroleum consumed (and therefore the carbon released) versus road travel.
(Thanks Chris)

