Step-By-Step: Getting Started with Azure Machine Learning
Artificial Intelligence (AI) study and use is on the rise. Tools to enable AI are becoming more readily available, simpler to use and easier to implement. What's more is that the definition of AI itself has been broken down into ingredients that, when later applied into a recipe (or process), can provide multiple desired outcomes. One of the more important ingredients used in most recipes is Machine Learning.
Machine Learning in essence is a way of teaching computers to provide more accurate predictions on provided data. These predictions can also make apps and devices smarter by providing recommendations as an outcome to the data.
In the pursuit of making roads safer, Toyota Canada has been capturing data from mechanics in all of Toyota Canada's 300 dealerships on the vehicles they repair. In the past, the repair data was extracted from Toyota Canada's service application manually and stored in databases on premise to later be analysed. While parts of the analytics process were automated, the entire process took over 6 months to process the reams of data to provide a part replacement recommendation. Toyota Canada wanted to reduce the process time and so approached Microsoft to collaborate in a Machine Learning Hackfest to come up with a solution.
While we are unable to detail the exact process undertaken by Toyota Canada and Microsoft as completed during the Hackfest itself, this post will walk through steps accomplishing a similar exercise to enable further understanding of the Machine Learning process. The step-by-step detailed below will set up a pricing prediction of specific vehicles.
Lets get started.
Step 1: Accessing Machine Learning Studio
To begin this exercise, navigate to https://studio.azureml.net and select Sign up here. Nextchoose between free and paid options to complete this exercise.
NOTE: Select Sign In if you have already completed a Machine Learning experiment previously and simple enter your credentials.

You are ready to begin the exercise once you are able to access the Microsoft Azure Machine Learning Studio.
Step 2: Getting the Data to Analyze
Next you'll need to acquire data to analyze. Machine Learning Studio has many sample datasets to choose from or you can even import your own dataset from almost any source. In keeping with the automotive theme, the Automobile price data (Raw) dataset will be used in this exercise. This dataset provides data on various cars including make, model, price and specifications
The first thing you need to perform machine learning is data. There are several sample datasets included with Machine Learning Studio that you can use, or you can import data from many sources. For this example, we'll use the sample dataset, Automobile price data (Raw) , that's included in your workspace. This dataset includes entries for various individual automobiles, including information such as make, model, technical specifications, and price.
NOTE: All data used in this exercise is factitious and does not represent the current automotive market.
Let's now capture the dataset for this experiment.
- Click +NEW located at the bottom of the Machine Learning Studio window to create a new experiment
- Select EXPERIMENT > Blank Experiment
- Name the experiment Automotive Price Prediction Exercise by selecting and replacing the text found at the top

- In the Search box located in the top left hand side, enter automobile to find the dataset labeled Automobile price data (Raw)
- Drag the dataset to the experiment canvas
 NOTE: Click the output port at the bottom of the automobile dataset, and then select Visualize to see what the automotive dataset looks like
Step 3: Preparation of the Data
Preprocessing the dataset is needed to ensure missing values are addressed prior to running the prediction exercise. As noted in the newly added automotive dataset, the normalized-losses column is missing many values and will have to be excluded to provide a better prediction.
- In the Search box located in the top left hand side, enter select columnsand located the Select Columns in Dataset module
- Drag the module to the newly created experiment canvas
NOTE: This module allows for the selection of columns of data to be included or excluded in this exercise - Connect the output port of the Automobile price data (Raw) dataset to the input port of the Select Columns in Dataset module
- Select the Select Columns in Dataset module
- Click Launch column selector in the Properties pane

- Click With rules located on the left
- Under Begin With, click All columns. This directs Select Columns in Dataset to pass through all the columns (except those columns we're about to exclude).
- From the drop-downs, select Exclude and column names, and then click inside the text box. A list of columns is displayed. Select normalized-losses, and it's added to the text box.
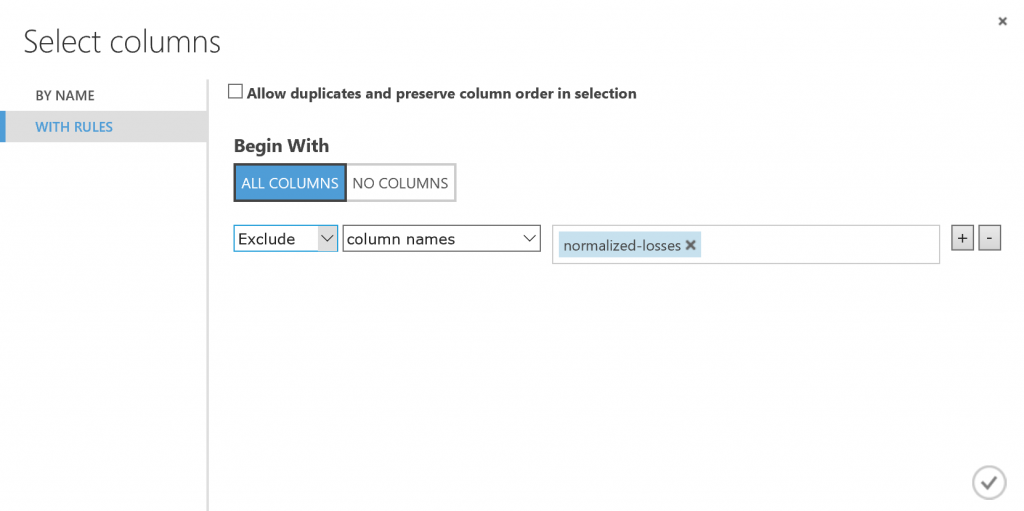
- Click the check mark to close the column selector
NOTE: The properties pane for Select Columns in Dataset now shows that all columns from the dataset will pass through except normalized-losses - Drag the Clean Missing Data module to the experiment canvas and connect it to the Select Columns in Dataset module
- In the Properties pane, select Remove entire row under Cleaning modeNOTE: This directs Clean Missing Data to clean the data by removing rows that have any missing values.
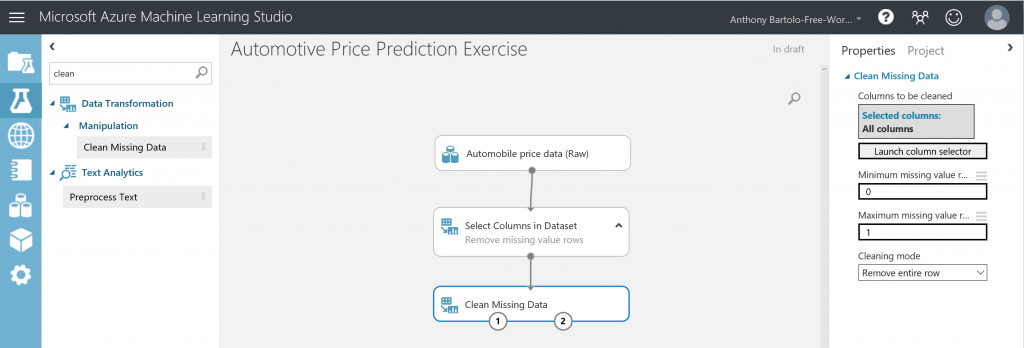
- Double-click the module and type the comment Remove missing value rows
- Click RUN at the bottom of the page
Step 4: Defining Features
Machine Leaning Features are individual measurable properties that are of interest. In Automotive Price dataset, each row represents one car, and each column is a feature of that vehicle. Experimentation and knowledge about the problem you want to solve are needed to find a good set of features to create a predictive model.
This experiment will build a model that uses a subset of the features in the automotive dataset. These features include:
make, body-style, wheel-base, engine-size, horsepower, peak-rpm, highway-mpg, price
- Find and drag another Select Columns in the Dataset module to the experiment canvas
- Connect the left output port of the Clean Missing Data module to the input of the Select Columns in Dataset module
- Double-click the module and type Select features for prediction
- Click Launch column selector in the Properties pane
- Click With rules
- Click No columns under Begin With
- Select Include and column names in the filter row
- Select the list of column names (as listed above prior to the start of Step 3's steps) in the text box
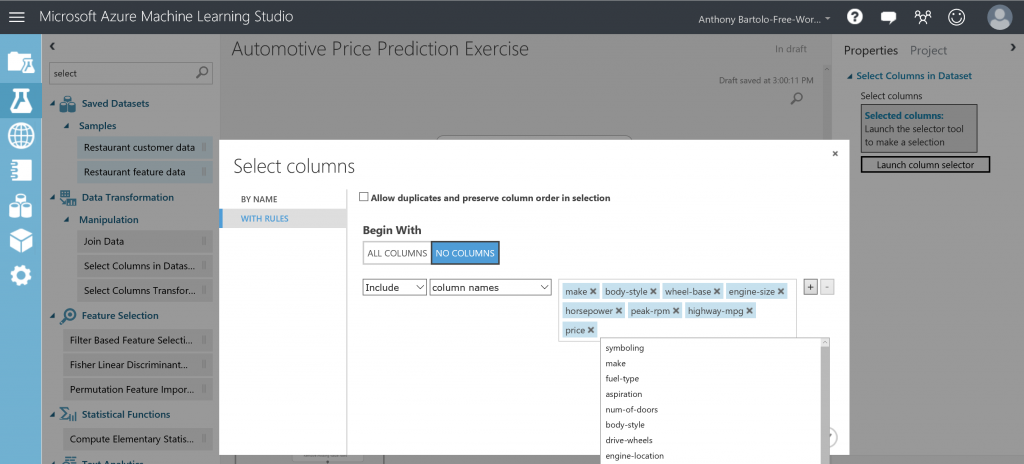
- Click the check mark button to confirm the selection
Step 5: Selecting and Applying a Learning Algorithm
With the appropriate data now repaired, training and testing of a predictive model can now commence. The data will now be uses to train the model and test the model to review price prediction. For this experiment the regression machine learning algorithm will be used.
Regression is used to predict a number which will come in handing when predicting pricing. More specifically, this experiment will use the simple linear regression model. The data itself will be used for both training the model and testing. This is completed by splitting the data into separate training and testing datasets.
- Find, select and drag the Split Data module to the experiment canvas
- Connect the Split Data module to the last Select Columns in Dataset module
- Click the Split Data module
- In the Properties pane to the right of the canvas, find the Fraction of rows in the first output dataset () and set it to 0.75
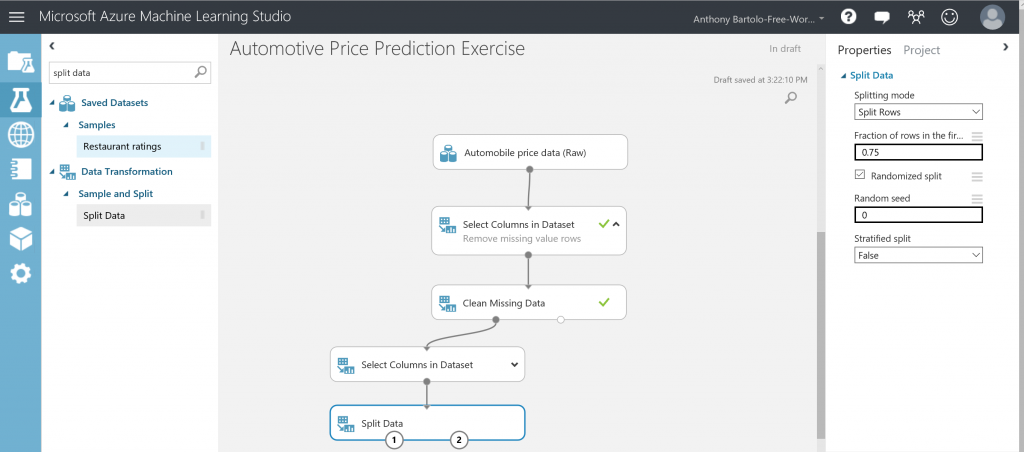
- Run the experiment
- Expand the Machine Learning category in the module palette to the left of the canvas to select the learning algorithm
- Expand Initialize Model
NOTE: This displays several categories of modules that can be used to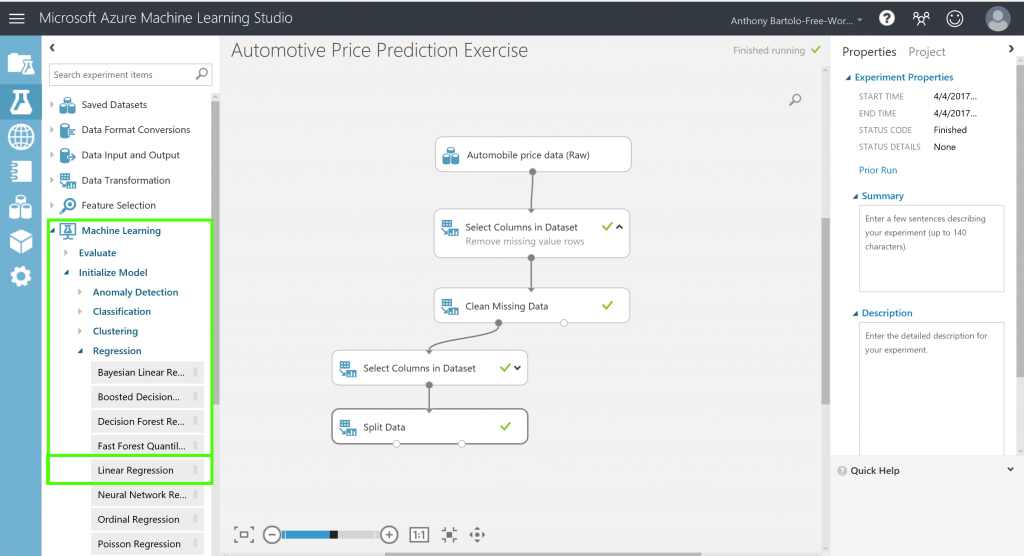 initialize machine learning algorithms
 - Select the Linear Regression module under the Regression category and drag it to the experiment canvas

- Find and drag the Train Model module to the experiment canvas
- Connect the output of the Linear Regression module to the left input of the Train Model module, and connect the training data output (left port) of the Split Data module to the right input of the Train Model module
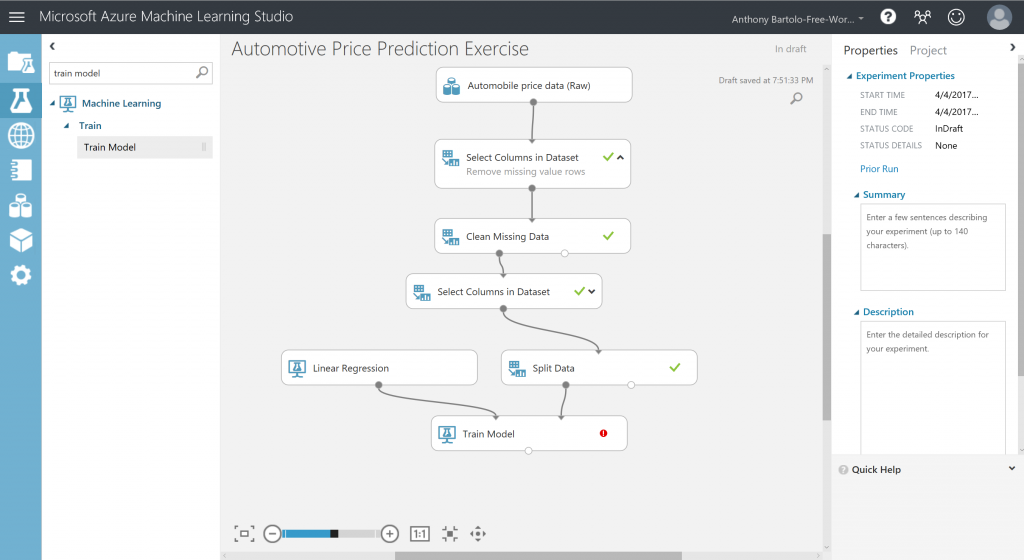
NOTE: Please pay attention to the port utilized as the experiment will not work if connected incorrectly - Click the Train Model module
- Select Launch column selector in the Properties pane
- Select the price column and move it to the Selected columns list (This is the value that the experiment is going to predict)
- Click the check mark button to confirm the selection
- Run the experiment
Step 6: Predict New Automobile Pricing
The experiment can now score the 25 percent of data to how the model functions being trained on the other 75 percent.
- Find and drag the Score Model module to the experiment canvas
- Connect the output of the Train Model module to the left input port of Score Model
- Connect the test data output (right port) of the Split Data module to the right input port of Score Model
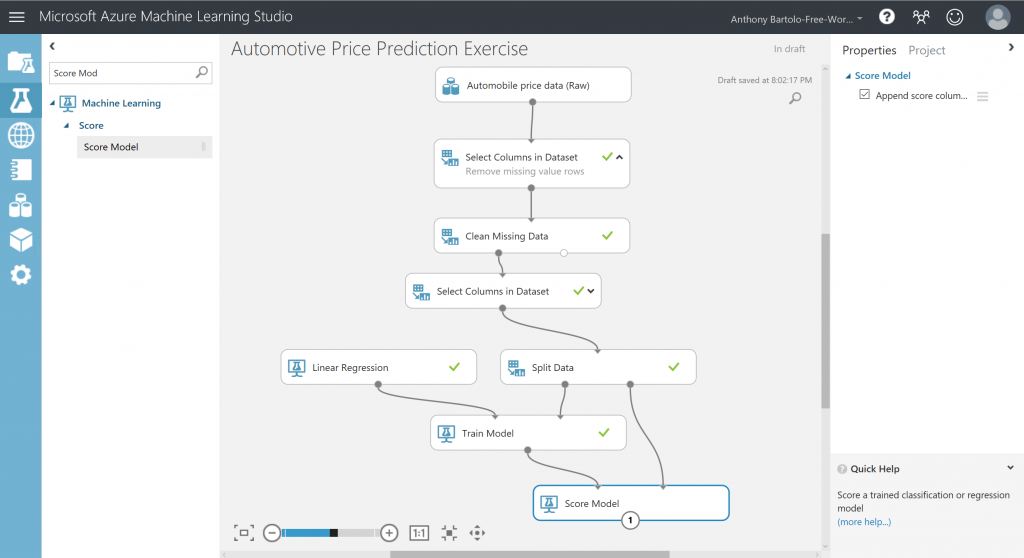
- Run the experiment
- Click the output port of Score Model and select Visualize toview the output from the Score Model module
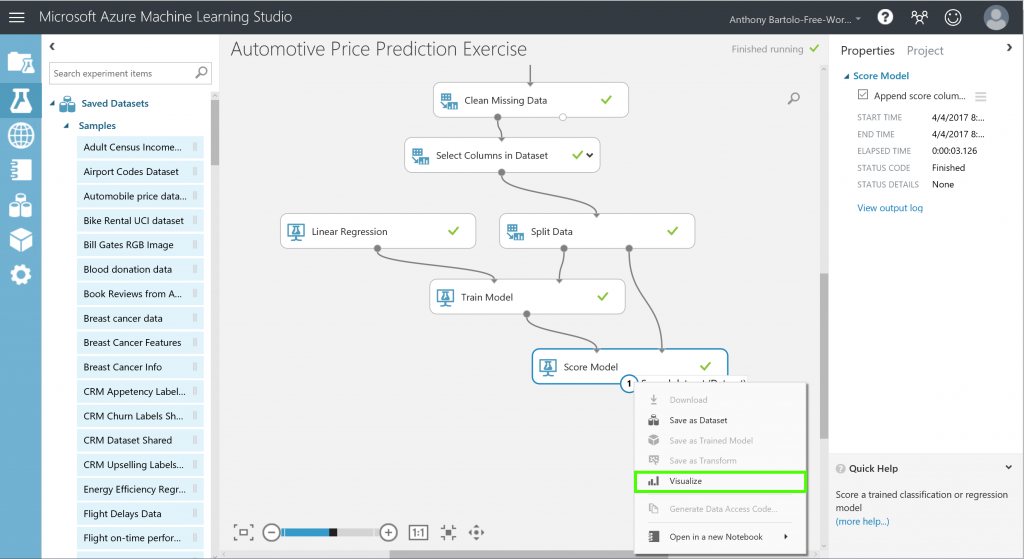
NOTE: The output shows the predicted values for price and the known values from the test data
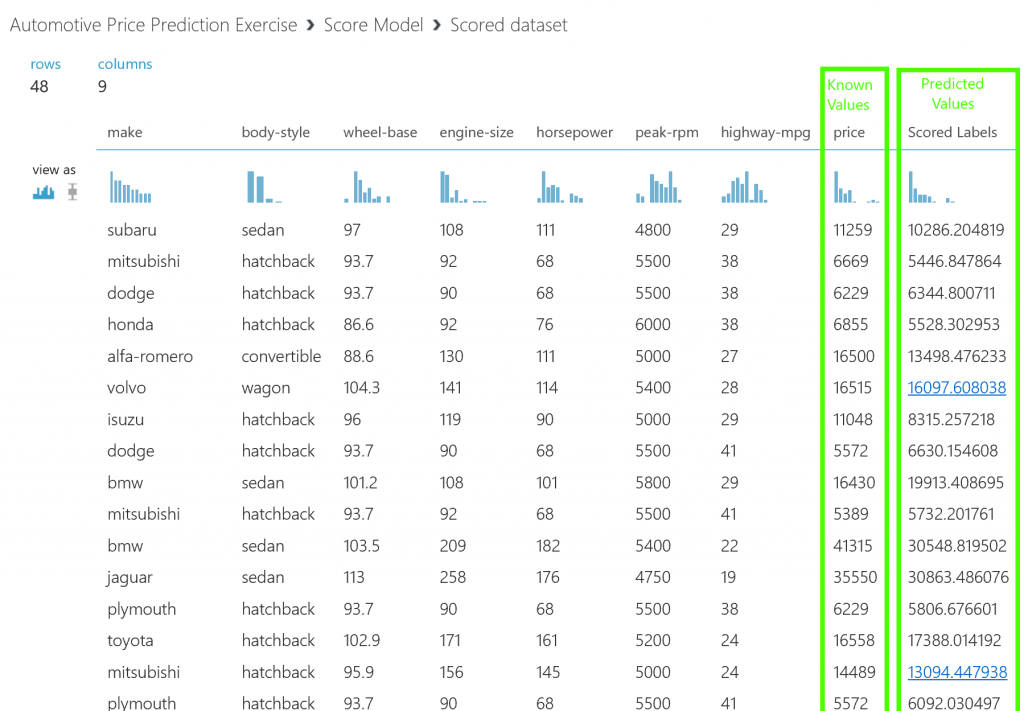
Congratulations as you have now completed your first machine learning experiment. Next steps would be to try an improve the prediction and then deploy it as a predictive web service. Experiment further by adding multiple machine learning algorithms, modifying the properties of the Linear Regression algorithm or trying a different algorithm altogether.