[PowerShell Script] Finding Out the Managed Objects that "Leaked"
Here in PFE most of my teammates use the same approach to identify managed objects that “leak”. The idea is to run !DumpHeap –stat once, wait several minutes to allow the “leak” to make itself evident, then run the command a second time.
After that you have to select those objects that appear in both outputs, and then find the instances which have the biggest delta between the outputs. That is, find the amount of increase/decrease of each type from the first time you executed the command compared to the second time.
Notice that you don’t take those objects using more memory, the fact they’re using more memory doesn’t mean they are “leaking”, you’re interested on those specific objects that have their instances increasing at higher rate than other objects.
As you can see you need to create a tool to do that if you don’t want to use Excel and lots of error prone manual work. Thinking about it, I conferred with my teammate Brad Linscott to create a simple PowerShell script that does the work for you.
The beauty of this approach is that it’s simple, you can change the code whenever you want and there’s integration with LogParser, so you can see a beautiful chart. (think about it when sending a report to your users or upper level managers J)
The script below is a standalone script, meaning it doesn’t require the PowerDbg library or any interaction with WinDbg.
To use it you have to get the output from !DumpHeap –stat whether you’re doing live debugging or post-mort debugging. It doesn’t matter; you just have to copy the output of this command and save it into a text file. You need two text files, so get them using at least 15 minutes of interval time to give some time for the “leak” to manifest itself.
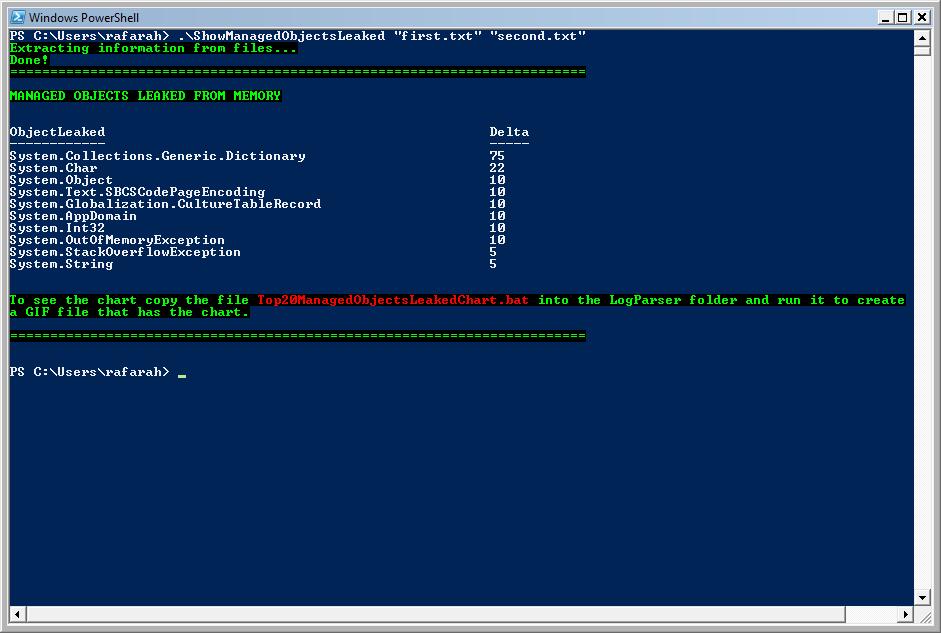
Upon running the script you’ll see the objects leaked and a number that is the Delta. As higher the Delta, higher is the probability the object leaked. You may also wish to run a Perfmon log during the data gathering, paying special attention to the GC counters in the .NET CLR Memory object to ensure that GC is occurring. Because if memory growth occurs with no GC, this is not an indication of a leak: either the GC hasn’t felt enough memory pressure to perform a GC or there is some other reason GC hasn’t run. Either way, you need to ensure that memory growth occurs in spite of GC occurring.
The chart will show you the same information in a graphical way, but just the top 20 objects leaked.
Note: The script does not check for leaks in the loader heaps (e.g., dynamic assemblies created due to, for example, compilation debug=”true”).
Note 2: This is a standalone script, it does not require the PowerDbg library.
Screenshots:
Source code for ShowManagedObjectsLeaked.ps1:
########################################################################################################
# Script: ShowManagedObjectsLeaked.ps1
#
# Parameters: [string] <$firstFile>
# Text file that has the output of !DumpHeap -stat
#
# [string] <$secondFile>
# Text file that has the output of !DumpHeap -stat. It should be collected minutes after the first file.
#
# Purpose: Shows the objects that are or may be causing a memory leak sorted by leak probability. It also creates
# a LogParser script to display a chart.
# To identify objects leaking the script gets the objects and number of instances from the two files, then
# it gets the objects that appear in these two files and have more instances coming
# from the second file. After that it calculates the delta, that is a number that represents the rate of
# increasing for each object. After that it displays the objects leaking sorted by this delta.
#
# Note: This is a standalone script, so it doesn't require PowerDbg.
#
# Changes History:
#
# Roberto Alexis Farah
# All my functions are provided "AS IS" with no warranties, and confer no rights.
########################################################################################################
param(
[string] $firstFile = $(throw "Error! You must provide the first text file that has the !DumpHeap -stat output."),
[string] $secondFile = $(throw "Error! You must provide the second text file that has the !DumpHeap -stat output.")
)
set-psdebug -strict
$ErrorActionPreference = "stop"
trap {"Error message: $_"}
# Do the file exist? Let's verify it.
if(((test-path $firstFile) -eq $false) -or ((test-Path $secondFile) -eq $false))
{
throw "Error! You must provide the text file that has the !DumpHeap -stat output."
}
########################################################################################################
# Function: Parse-DumpHeapStat
#
# Parameters: [string] <fileName> - File that has the output of !DumpHeap -stat
#
# Return: Hash Table where the key is the object name and the value is the number of instances.
#
# Purpose: Extracts all objects and instances from !DumpHeap -stat and save it into a hash table.
# Note: It'll become a cmdlet forr PowerDbg soon. :)
#
# Changes History:
#
# All my functions are provided "AS IS" with no warranties, and confer no rights.
########################################################################################################
function Parse-DumpHeapStat([string] $fileName = $(throw "Error! You must provide the path and file name."))
{
$output = @{}
# Expression: \S+\s+(\d+)\s+\S+\s+([0-9a-zA-Z\.]+)
# \S+ --> Scans one or more chars/digits/numbers without spaces.
# \s+ --> Scans for one or more spaces.
# (\d+) --> Gets one or more digits.
# \s+ --> Scans for one or more spaces.
# \S+ --> Scans one or more chars/digits/numbers without spaces.
# \s+ --> Scans for one or more spaces.
# ([0-9a-zA-Z\.]+) --> Gets all chars, numbers and '.'. Discard comma and others. The idea is to get just the namespace.
foreach($line in $(get-content $fileName))
{
# Checks if the pattern matches.
if($line -match "(\S+\s+(?<value>(\d+))\s+\S+\s+(?<key>([0-9a-zA-Z\.]+)))")
{
# Save the key and value in our hash table.
$output[$matches["key"]] = $matches["value"]
}
}
return $output
}
########################################################################################################
# Function: Save-ObjectsLeaking
#
# Parameters: <firstHashTable> - Hash table containing objects and instances.
# <secondHashTable> - Hash table containing objects and instances.
# [string] <csvFileName> - Name of the CSV file to be created.
#
# Return: CSV file that has just the objects leaked.
#
# Purpose: Compare the two hash tables with objects and instances, considering only objects that:
# 1- Appear in both hash tables.
# 2- The number of instances from the second hash table is bigger than the first hash table.
#
# After that it calculates the delta, that is the rate of increasing of objects of the same type.
# The output is a CSV file which is not sorted. The CSV file has the object as key and delta as value.
#
# Changes History:
#
# All my functions are provided "AS IS" with no warranties, and confer no rights.
########################################################################################################
function Save-ObjectsLeaking(
$firstHashTable = $(throw "Error! You must provide the hash table."),
$secondHashTable = $(throw "Error! You must provide the hash table."),
$csvFileName = $(throw "Error! You must provide the name of the CSV file that will be created.")
)
{
# Prepare string to create CSV file.
$builder = New-Object System.Text.StringBuilder
# Title for the CSV fields.
$builder = $builder.AppendLine("ObjectLeaked,Delta")
# Scans the 'firstHashTable' and tries to locate the same object in 'secondHashTable'.
# After that, checks if the number of instances is bigger in the second hash table.
foreach($object in $firstHashTable.keys)
{
# Is the object present in the second hash table, too?
# Notice that we want to ignore Free objects since we're not interested on them.
if($secondHashTable[$object] -and ([string]::Compare($object, "Free", $true) -ne 0))
{
# Is the number of instances bigger in the second hash table?
if([System.Convert]::ToInt32($secondHashTable[$object]) -gt [System.Convert]::ToInt32($firstHashTable[$object]))
{
# Calculates delta and save it.
$builder = $builder.AppendLine($object + "," + [int] ([System.Convert]::ToInt32($secondHashTable[$object]) / [System.Convert]::ToInt32($firstHashTable[$object])))
}
}
}
# Send output to the CSV file.
out-file -filepath $csvFileName -inputobject "$builder"
return
}
write-Host "Extracting information from files..." -foreground Green -background Black
# Gets objects and instances from the first file.
$outputFirstFile = Parse-DumpHeapStat $firstFile
# Gets objects and instances from the second file.
$outputSecondFile = Parse-DumpHeapStat $secondFile
$csvFile = "ManagedObjectsLeaked.CSV"
$csvFileSorted = "SortedManagedObjectsLeaked.CSV"
# Gets just the objects leaking, ignoring Free objects.
Save-ObjectsLeaking $outputFirstFile $outputSecondFile $csvFile
write-Host "Done!" -foreground Green -background Black
# Sort CSV file and select the top 20 items based on occurrences.
import-csv $csvFile | sort-object {[int] $_.Delta} -desc | select-Object -first 20 | export-csv $csvFileSorted -notypeinformation
# Creates LogParser file.
[string] $logParser = "logparser.exe `"SELECT ObjectLeaked, Delta INTO Top20ManagedObjectsLeaked.gif FROM " + [system.io.path]::GetFullPath($csvFileSorted) + " ORDER BY Delta DESC`" -i:CSV -o:CHART -charttype:ColumnClustered -groupsize:512x480 -chartTitle:`"Top 20 Managed Objects Leaked`" -e:1"
$batFile = "Top20ManagedObjectsLeakedChart.bat"
out-File -filepath $batFile -inputobject $logParser -encoding "ASCII"
write-Host "========================================================================" -foreground Green -background Black
write-Host "`nMANAGED OBJECTS LEAKED FROM MEMORY`n" -foreground Green -background Black
import-Csv $csvFileSorted | format-Table -autosize
write-Host "`nTo see the chart copy the file " -foreground Green -background Black -nonewline
write-Host $batFile -foreground Red -background Black -nonewline
write-host " into the LogParser folder and run it to create`na GIF file that has the chart." -foreground Green -background Black
write-Host "`n========================================================================" -foreground Green -background Black
Comments
Anonymous
November 13, 2008
PingBack from http://www.tmao.info/powershell-script-finding-out-the-managed-objects-that-leaked/Anonymous
November 18, 2008
Hi Roberto, I would like to add a breakpoint in the moment in where my app is changing their cursor to hourglass, extract the stacktrace and see why the cursor is changing, may you help me on that please? how can I see all methods of the current managed DLL's? Regards REne.Anonymous
November 18, 2008
The comment has been removedAnonymous
November 19, 2008
Thanks for your quick response Roberto, unfortunately I do not have access to the source code, in order to make easier things, is there any way to run something similar like this in .NET Framework with SOS.DLL ? command: bm *!cursor Or is there any way to see which is the method that is owner of the System.Cursor object? Thanks :)Anonymous
November 19, 2008
Rene, if the code is not obfuscated you can use !saveallmodules and open the suspect modules using .NET Reflector. With this tool it should be easy to find the methods related to cursor. Another approach: you can setup a breakpoint with !bpmd: BPMD [<module name> <method name>] [-md <MethodDesc>] Creates a breakpoint at the specified method in the specified module. If the specified module and method have not been loaded, this command waits for a notification that the module was loaded and just-in-time compiled before creating a breakpoint. Using: !bpmd <modulename> <method that changes cursor> http://blogs.msdn.com/kristoffer/archive/2007/01/02/setting-a-breakpoint-in-managed-code-using-windbg.aspx This should be enough to stop the debugger when the cursor is going to be changed. Yet another approach: x *!cursor <-- You can see all APIs that use Cursor bp user32!ShowCursor "kbn 1000" bp user32!SetCursor "kbn 1000" http://msdn.microsoft.com/en-us/library/ms648393(VS.85).aspx It should be enough. If not, put breakpoints in other APIs that change the cursor. Note: My answer may not be 100% accurate. I haven't tested it so you may need to do some minor changes. Good luck!Anonymous
November 20, 2008
Hi Roberto, Thanks for your response, Do you have a good documentation about what is a "method description", or "method table"? Regards ReneAnonymous
November 20, 2008
You're welcome! Here is some good documentation: http://msdn.microsoft.com/en-us/magazine/cc163791.aspx http://msevents.microsoft.com/cui/WebCastEventDetails.aspx?EventID=1032292286&EventCategory=3&culture=en-US&CountryCode=US This book great: http://www.microsoft.com/MSPress/books/6522.aspx Have fun! :)Anonymous
November 26, 2008
Hi Roberto, thanks for your quick answers, I have another question, What means: 0f16f1ac 7c812aeb [HelperMethodFrame_PROTECTOBJ: 0f16f1ac] System.String.Replace(System.String, System.String) HelperMethodFrame_PROTECTOBJ ? Regards Rene.Anonymous
December 17, 2008
Hi Rene, I couldn't find an accurate answer to your question so I owe you that. I just found this link. It may help, or maybe the blogger knows the answer: http://blogs.msdn.com/yunjin/archive/2004/02/08/69906.aspx ThanksAnonymous
July 29, 2009
Nice script... and nice free consulting for Rene, hah! Any ideas why this entry showed up at the top of your RSS feed on 7/28/09 when the post is archived back in 11/14/08? Cheers!Anonymous
August 07, 2010
Hi Roberto, can you check out the Save-ObjectsLeaking function. I get the impression that the delta value is not calculate correctly (shouldn't it be a - b i.s.o. a / b!?) Regards TomAnonymous
August 07, 2010
The comment has been removedAnonymous
September 11, 2010
The comment has been removed