Are You Reporting Inaccurate Performance Numbers with VS 2008?
There’s a hidden problem with VS 2008 load testing that you need be aware if you are running tests locally (as opposed to using a controller and agents).
If you purchase and run a load agent, load agents run on all cores and all CPUs on the machine.
However, when running locally VS limits load generation to one core on the machine. If this core is running at or close to 100% CPU utilization, it will throw off performance measurements and interfere with performance counter collection. In general it really invalidates your test results. This is why we graph agent CPU by default, and have performance counter thresholds that fire to warn you if the test is running too hot. However, by default the test is configured to look at the _Total instance, when it should be looking at the “0” instance.
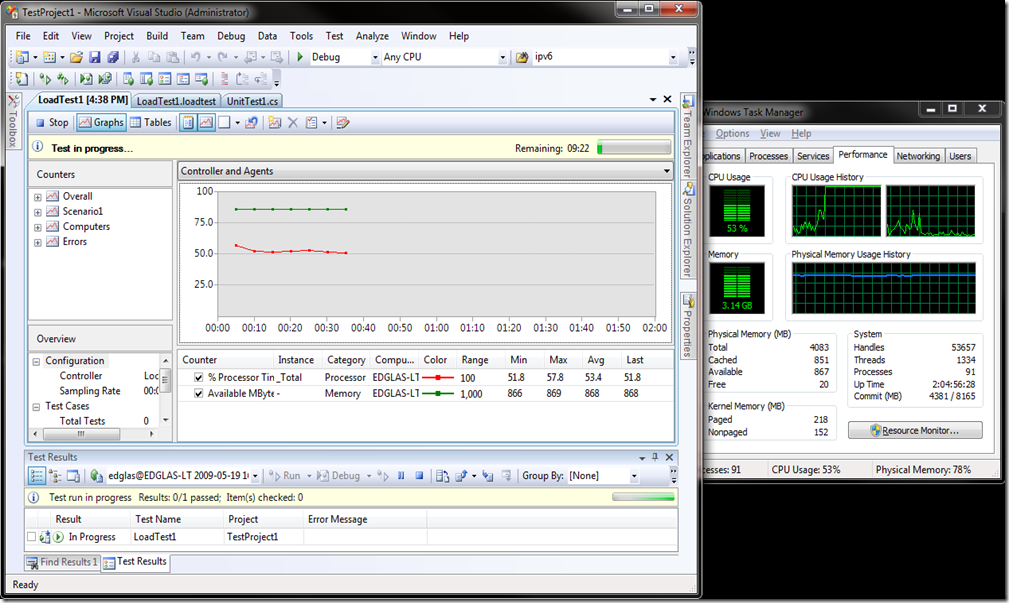
This screen shot really tells the story:
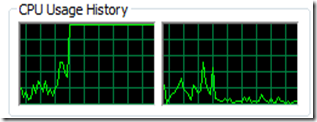
CPU 0 is clearly pegged:
Yet the CPU counter in the load test is reporting ~50% utilization:
What is going on here is that the counter reported on is the _Total counter.
To get an accurate measurement we should graph the instance 0 counter instead.
To change your tests to graph the instance 0 counter, change the counter instance in the load test editor:
Now if I re-run, alarm bells should go off as thresholds violations. But they don’t!
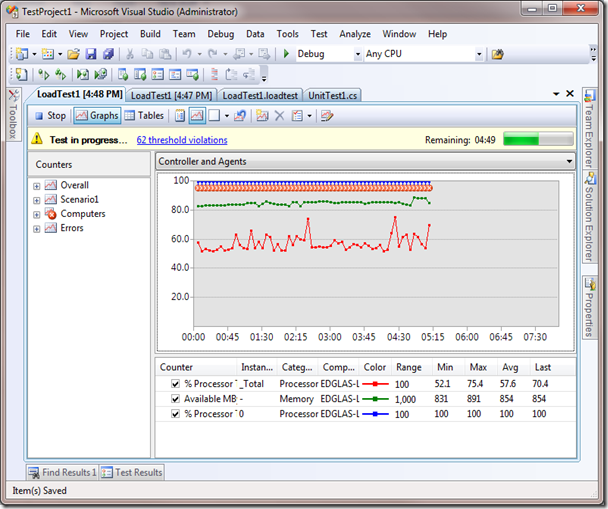
The reason is the analyzer is still displaying the _Total instance by default. However, you can see the threshold violation is now firing:
To graph instance 0, drill into the counter tree and drag it on the graph:
Now you can see the threshold violations displayed on the graph. To graph the "0" instance by default, edit the .loadtest file in the xml editor and change the instance:
<DefaultCountersForAutomaticGraphs>
<DefaultCounter CategoryName="Processor" CounterName="% Processor Time" InstanceName="0" />
<DefaultCounter CategoryName="Memory" CounterName="Available MBytes"/>
</DefaultCountersForAutomaticGraphs>
You can fix this for all subsequent load tests you create by editing the <installdir>\Common7\IDE\Templates\LoadTest\CounterSets\AgentCounterSet.CounterSet file and adding a new instance tag for the “0” instance:
<CounterCategory Name="Processor">
<Counters>
<Counter Name="% Processor Time">
<ThresholdRules>
<ThresholdRule Classname="Microsoft.VisualStudio.TestTools.WebStress.Rules.ThresholdRuleCompareConstant, Microsoft.VisualStudio.QualityTools.LoadTest">
<RuleParameters>
<RuleParameter Name="AlertIfOver" Value="True" />
<RuleParameter Name="WarningThreshold" Value="90" />
<RuleParameter Name="CriticalThreshold" Value="95" />
</RuleParameters>
</ThresholdRule>
</ThresholdRules>
</Counter>
<Counter Name="% Privileged Time" />
<Counter Name="% User Time" />
</Counters>
<Instances>
<Instance Name="_Total" />
<Instance Name="0" />
</Instances>
</CounterCategory>
Also change the settings for the default counters to show on the graph:
<DefaultCountersForAutomaticGraphs>
<DefaultCounter CategoryName="Processor" CounterName="% Processor Time" InstanceName="0" />
<DefaultCounter CategoryName="Memory" CounterName="Available MBytes"/>
</DefaultCountersForAutomaticGraphs>
Hope that helps, and we certainly will get this fixed for dev10 (but the fix did not make it into beta1).
Ed.
Comments
Anonymous
May 19, 2009
PingBack from http://asp-net-hosting.simplynetdev.com/are-you-reporting-inaccurate-performance-numbers-with-vs-2008/Anonymous
May 19, 2009
Thank you for submitting this cool story - Trackback from DotNetShoutoutAnonymous
November 18, 2009
Thank you for submitting this cool story!


