Evaluating the "Reach" of Our Opalis Infrastructure at Microsoft
Hello readers. This is my first technical post of hopefully many on the topic of all things Opalis and Orchestrator! This product keeps me up at night (in a good way ![]() ) so I should have plenty of interesting content as time goes on.
) so I should have plenty of interesting content as time goes on.
Challenge and Initial Questions
So considering our vast collection of systems here at Microsoft that we support across the world, it was clear that some analysis needed to be done on what our initial Opalis 6.3.3 environment needed to look like to support our diverse environment. With various sites and bandwidths, some with latent links, we needed a way to determine how far reaching our Opalis Action Server could reach into our infrastructure and perform certain actions. The goal was to leverage a single Management Server cohosting the SQL DB for Opalis, and a single / separate Action Server to manage our policy execution.
Answering the Challenge
So what better way to answer the question of Reach than to use a workflow within Opalis to evaluate scenario-based tests.
Main Orchestration Workflow
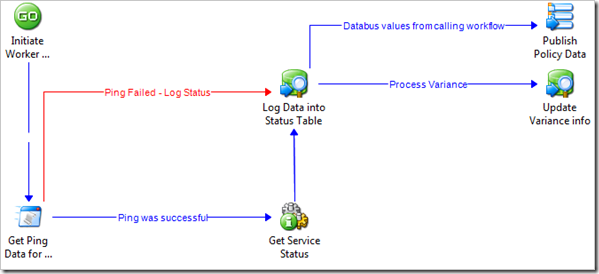
The main orchestration workflow (shown above) breaks out into the following components
- Scheduler: We setup a schedule for our workflow to fire every 4 hours. Having a schedule applied to our workflow provided us the ability to run this automatically, on a scheduled basis, collecting historical data that could be correlated later on for more interesting trend analysis.
- Table Creation: This task creates a status table (if it doesn’t exist) to hold the reach data that we are gathering as part of this analysis workflow
- Get Computers: This activity is reading in an array of computer systems for processing by pulling in a list of systems from a text file sitting on a share.
- Get Ping and Service Status: This activity is triggering the sub workflow for gathering our analysis data as well as logging that information in the status table we created in activity 2 above.
Ping and Service State Sub Workflow
Now to break out the sub workflow components (shown above). This is where the heavy lifting happens!
- Initiate Worker: This activity is a custom start object that holds a computer name from the list of computers gathered in the main workflow above.
- Get Ping Data: This activity is a PowerShell script that initiates a ping and stores the results as well as the latency measured during that ping for the host that we are evaluating.
- If the ping fails, it goes directly to Log Data into Status Table and then moves to the next system
- If the ping is successful, it moves to Get Service Status.
- Get Service Status: This activity is using the computer named pulled from the initiate activity above and checks service stated on a predefined service we are interested in. In our case (SMS Agent Host)
 . Status of the service state is logged into the Log Data into Status Table activity.
 - Log Data into Status Table: This activity essentially takes the computername, status of the ping (success/failure), latency data and service state and inserts them into an entry into the status table for this machine.
- Update Variance info: This activity takes the data for the previous run of this workflow for a particular computer analyzed, and analyzes the variance (+ / – ) from the last time it was run for latency data. Essentially this tells you where the ping latency was higher or lower from the last run potentially giving you an idea of trends for your network connectivity.
Results
So what do we get with all of this? We get a table. However, that table contains historical data that can be analyzed over time for trends, success / failure of activities, potentially to be leveraged for decisions regarding how far your reach can be within your organization for Opalis Action Servers.
Example Data
For us, it showed we had quite a bit of reach from our Opalis Action Server, even over high latency. The fine print on this is that “your mileage may vary” and likely will depending upon the health of your network and what you are attempting to do over the links at the end of your network from your core Opalis Action Server. The above scenario that I walked through can certainly be modified by grabbing the attachment provided and updated according to your own needs. Take out service check and add file copy, or add a file copy, or event log combing, etc. The rest is up to you.
Note: A huge thank you goes out to Benjamin Reynolds (our local SQL guru within the MPSD Platform and Service Delivery teams) for helping me with the variance data query provided in this workflow. A final obligatory note – use at your own risk and support and only after testing in your environment – and have fun building automation!
Download Workflow Here ReachFiles.zip
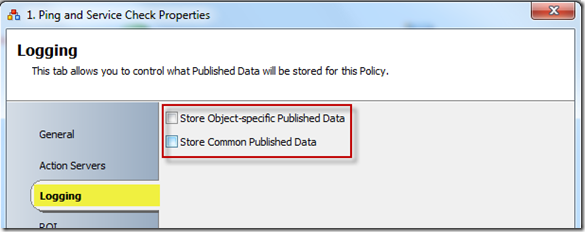
A final note: The workflow that is attached in the above download has the logging turned on for the purposes of showing logging information during execution. If you decided to implement this into production, it is best practice to remove these options to avoid the excessive logging that is possible with the frequency of run and number of servers you may run this against. If you leave these settings as is, the sub workflow (Ping and Service Check) will eventually lock up when viewed in the OIS client due to logs being populated at the bottom of the designer.
Comments
Anonymous
January 01, 2003
Hi Jim Me again :). We usually monitor the service state as is and at least one additional functionality of the service to not depend only on the monitor state (Which as I described could be false positive). I work in the healthcare business and alot of our integrated systems work with file interfaces (hl7 data submissions) so we check those folders as well to make sure, said service imports / exports files! Regards AlexAnonymous
January 01, 2003
Pablo, Thank you. I appreciate the feedback. Opalis / Orchestrator is an amazing solution - I'm sure you'll feel the same once you start to peek under the hood and see what it is all about and what it can offer. Thanks for the post. JimAnonymous
January 01, 2003
Alex, thanks for the comments. You can thank Charles Joy (blogs.technet.com/.../charlesjoy) for the idea of SQL - he's a huge fan of SQL :) so of course I became a huge fan as well. It is a great way to store data (temporarily or over time) that you need to query, report on later, or leverage for published data in a workflow or sub workflow. As far as the question you raised, my recommendation there (depending upon your scenario) is to take a look at PowerShell (run.Net object) as a way to do what you are looking to do. Run.Net PowerShell does a pretty good job and has some flexiblity around potentially checking the state of the service (stopped, running, starting, paused, stopping). Example: PS>"bits" |Get-Service -computer server01|fl Name : bits DisplayName : Background Intelligent Transfer Service Status : Running DependentServices : {} ServicesDependedOn : {EventSystem, RpcSs} CanPauseAndContinue : False CanShutdown : False CanStop : True ServiceType : Win32ShareProcess You could put a loop on that activity with timing in between depending upon what you are doing as well. Hope that helps! There are a lot of ways to do the same thing in Opalis - just really depends on your situation. Good luck - thanks for the post as well! JimAnonymous
January 01, 2003
Alex, thanks for the follow up. One thing I'd like to add here - Opalis / Orchestrator is really about IT Process Automation and working with solutions like SCOM as an example to provide enhanced automation and remediation. For the details you are describing, I'd recommend (if you haven't already) reviewing System Center Operations Manager (SCOM) to monitor the critical systems and have Opalis "react" to service outages and automate the remediation and possibly log those remediations in a service desk solution (like System Center Service Manager). Linking these together would give you an enhanced solution where esclation could happen by Operations Manager through Service Manager to Opalis, Opalis then could resolve the issue and update status and tracking information in Service Manager and close the ticket or escalate as appropriate. Thanks again for the explanation of your environment. Happy automating :)Anonymous
May 31, 2011
Hi Jim Great idea with logging Opalis data into a Database. Haven't thought about that so far! The biggest problem I'm facing here though is that the "Monitor Service" object just checks for the status and not for the service activity. Like if the service hang itself up but is still stated as "started". Do you have any backup / secondary check to see if a service runs for real?Anonymous
June 01, 2011
Great "applies to everybody" example. This post makes me wanna try the product. Thank You very much Jim


