Updated WPFPerf Performance Profiling Tools for WPF
The WPFPerf tool comprises of a suite of performance profiling tools that allow you to analyze the run-time behavior of your WPF application and point to potential performance bottlenecks.
We now added some new functionality as well as given the tool a major facelift.
Below are highlights for some of the exciting improvements that are included in this update.
More details and download link is available here.
Most of the concepts on how to use the tool remain the same so you can still refer to the existing documentation for the tool here to learn more. The tool should work on all 3.x version of .Net.
Note: some folks reported issues when installing on none-US machines. Until this is investigated, please install only on US machine using the default local settings.
A) Much improved “Visual Profiler” tool:
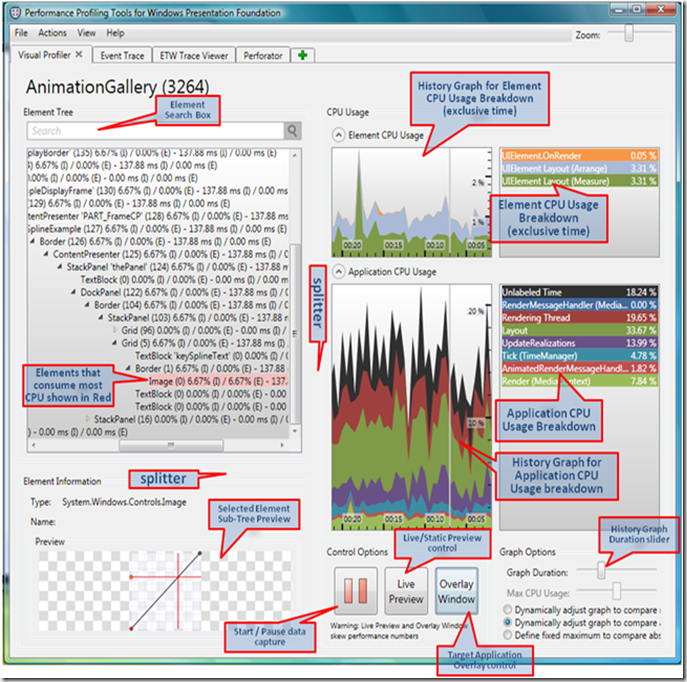
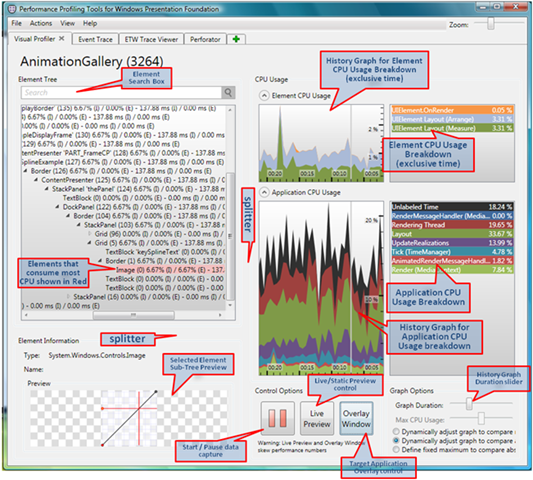
The Visual Profile tool now provides:
1) Search: provides the ability to search element in the application’s Element Tree.

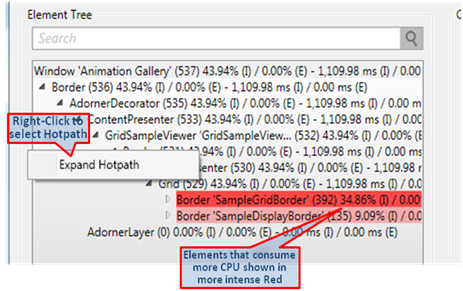
2) Hotpath: Allows you to Right Click / Expand Hotpath on an Element Tree, the tree will expand to show the element in the sub-tree that consumes the most amount of CPU in that sub-tree.
3) Elements CPU Usage: As user expands the Element Tree (e.g. by using the Hotpath feature from above), elements that (Exclusively) consumes CPU time are highlighted in Red. The intensity of the Red highlighting corresponds to the percentage of CPU usage.
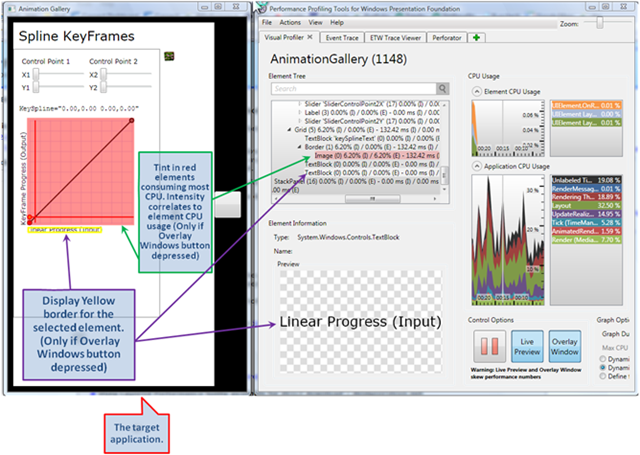
4) Tinting the Target Application : Using the Overlay Window button, you can view the Selected and Hotpath sub-tree elements in their target application.
If the Overlay Window button is depressed, then:
- Selecting an element in Visual Profiler’s Element Tree will draw a yellow rectangle on that same element in the target application.
- Hotpath elements are tinted in Red in the target application. The intensity of the Red tinting in the target application corresponds to the percentage of CPU usage.
Here is an example of how target application may look:
Note: Enabling this feature will slow the target application performance. In addition, tinting the target application uses Layered Windows. It is recommended that users follow this blog to make to obtain latest QFEs (or use XP Sp3 or Vista Sp1)
5) Live Preview: If the “Live Preview” is enabled, then in a live representation of the selected Element sub-tree is drawn on the bottom left. Otherwise a static image of the sub-tree is displayed.
In both cases, the image will change if another Tree Element is selected.
Note: Enabling this feature will slow the target application performance.
6) Splitter control: Allows user to adjust the various display areas (E.g. the Element Tree & Element Information areas)
7) Graph Duration Slider: Allow user to change the amount of history data collected.
8) Expander controls: Allow user to remove un-wanted clutter from the screen
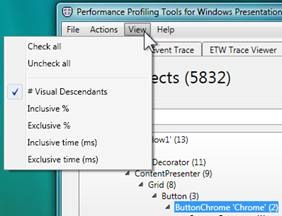
9) Element Tree View: Using the View menu you can control what information is displayed on the each node in the Element Tree and remove unwanted clutter.
B) Much improved “Perforator” tool:
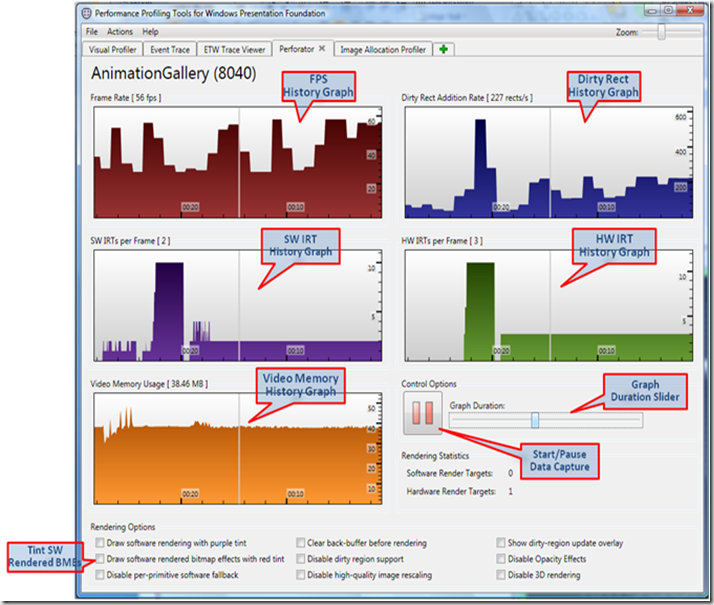
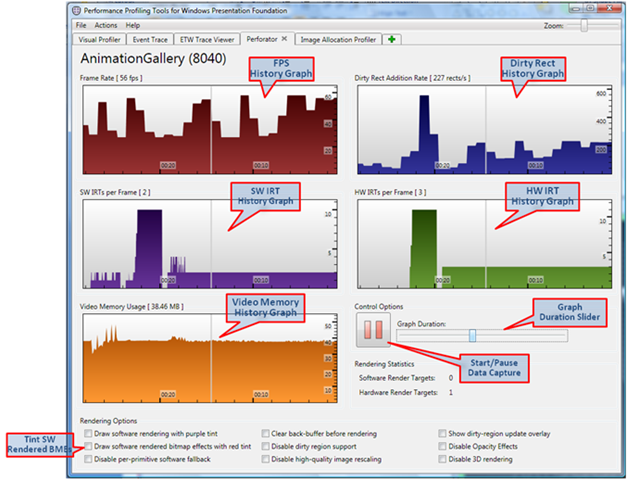
The Perforator tool now provides:
1. Improved UX : More intuitive and richer UX.
2. History Data:
- History Graphs of Frames-Per-Second, Direct Rectangles Addition Rate, HW and SW IRT count and Video Memory Usage.
- Graph Duration slider to change the amount of history data.
- Capture Start/Pause button to allow pause and re-capture of data.
The History Graph value axis (Y-Axis) is now auto-adjusting.
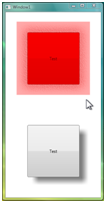
3. Detect SW rendered Bitmap Effects: Checkbox added to tint the target application elements that use SW rendered legacy Bitmap Effects.
In below example, the top button is decorated with OuterGlowEffect Bitmap Effect. Since this effect is not HW accelerated the Button is tinted in Red.
The bottom Button is decorated with DropShadow Bitmap Effect which is HW accelerated (DropShadow is now HW accelerated in .Net 3.5 Sp1), and therefore is not tinted with Red.
 Known limitations:
A) You must force the target elements to redraw itself after you enabled the checkbox for you to see the red tint. E.g. hover over with the mouse, if it is standard button.
B) You still need to launch Perforator before you launch your app.
C) New tool: String Allocation Profiler
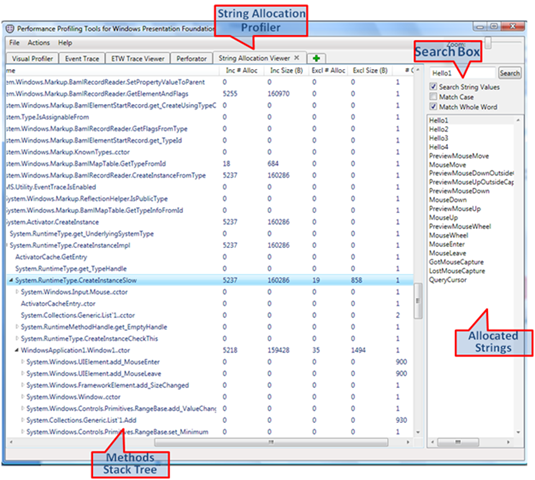 We added a new tool to WPFPerf called “String Allocation Profiler”
The tool enables users to view all the strings and their sizes which were allocated by the application from the time the application started till the time it closed.
To use this tool:
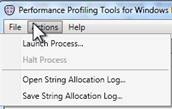
1. Click on “Action / Lunch Process…” to launch the target application.
Notice that WpfPerf says “Profiling…” on the status bar![clip_image002[4]](https://msdntnarchive.blob.core.windows.net/media/TNBlogsFS/BlogFileStorage/blogs_msdn/jgoldb/WindowsLiveWriter/UpdatedWPFPerfPerformanceProfilingToolsf_14280/clip_image002%5B4%5D.jpg)
2. Click around your application and when done close it.
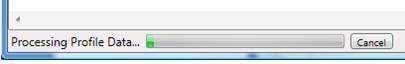
Notice that WpfPerf says “Processing Profile Data…” on the status bar
3. When done, WpfPerf displays the application method tree and for each method it shows the Inclusive and Exclusive # of strings allocations and their sizes.
4. You can drill down the application Method Stack Tree to view all the strings your application allocated in a specific method sub-tree.
5. Search: If you know the string names you can also search for them and find the methods that allocated them.
6. Using the “Action/Save String Allocation Log” and “Action / Save String Allocation Log” menu, you can save and open a view allocation logs at a later point.
Notes:
a) The tool display strings allocated directly by the application (in code and XAML) as well as strings allocated by the CLR and WPF framework.
b) The tool have affect on the performance of you application while it monitors string allocations.
D) ETW Event Tracing tool:
Some bugs fixed, and new detailed documentation for the WPF ETW events is now available. See more here.
E) General improvements:
1) Numerous bug fixes
2) Now you can attach and profile XBAPs in addition to Standalone WPF apps
3) Improved “Add Tool” dialog.
It now allows user to select more than one tool at a time.
![clip_image002[6]](https://msdntnarchive.blob.core.windows.net/media/TNBlogsFS/BlogFileStorage/blogs_msdn/jgoldb/WindowsLiveWriter/UpdatedWPFPerfPerformanceProfilingToolsf_14280/clip_image002%5B6%5D.jpg)
4) UI improvements to the “Select Process” dialog.
This allows user to select the target application to profile.
![clip_image004[5]](https://msdntnarchive.blob.core.windows.net/media/TNBlogsFS/BlogFileStorage/blogs_msdn/jgoldb/WindowsLiveWriter/UpdatedWPFPerfPerformanceProfilingToolsf_14280/clip_image004%5B5%5D.jpg)
5) UI improvements to the “Launch Process” dialog.
![clip_image006[5]](https://msdntnarchive.blob.core.windows.net/media/TNBlogsFS/BlogFileStorage/blogs_msdn/jgoldb/WindowsLiveWriter/UpdatedWPFPerfPerformanceProfilingToolsf_14280/clip_image006%5B5%5D.jpg)
F) Know issues and Caveats:
- General:
Try to avoid using more than one tool (e.g. Visual profiler & Perforator) at the same time to profile the same app as it will decrease the application performance. - Perforator/ Detect SW rendered Bitmap Effects:
When you set “Detect SW rendered Bitmap Effects”, in order for the Red tint to show, you must force the target elements to redraw itself. - Perforator/ Overlay Window:
Tinting the target application uses Layered Windows. It is recommended that users follow this blog to make to obtain latest QFEs (or use XP Sp3 or Vista Sp1) - Perforator/ Live Preview:
Live Preview uses Visual brush, so if you also use Perforator to profile the same app, you may see that the HW IRT count increases by 1. - Perforator/Visual profiler
You can attach to an XBAP (by attaching to PresentationHost.exe), but you may not able to launch an XBAP. - Perforator/Visual profiler
You must launch Perforator before you launch your app.
Please enjoy the tool and tell us what you think and what needs improvement.
Comments
Anonymous
September 25, 2008
PingBack from http://blog.a-foton.ru/2008/09/updated-wpfperf-performance-profiling-tools-for-wpf/Anonymous
September 25, 2008
You've been kicked (a good thing) - Trackback from DotNetKicks.comAnonymous
September 26, 2008
The WPFPerf tool comprises of a suite of performance profiling tools that allow you to analyze the runAnonymous
September 26, 2008
http://weblogs.asp.net/markwisecarver/archive/2008/09/26/updated-wpfperf-performance-profiling-tools-for-wpf.aspxAnonymous
September 26, 2008
Cannot run the 64bit version on my Vista 64bit machine: Could not load file or assembly 'WpfPerf, Version=0.0.0.0, Culture=neutral, PublicKeyToken=31bf3856ad364e35' or one of its dependencies. Strong name validation failed. (Exception from HRESULT: 0x8013141A)Anonymous
September 26, 2008
Finally, after a long time of silence, the new version of WPF Performance Profiling Tool is availableAnonymous
September 26, 2008
Finally, after a long time of silence, the new version of WPF Performance Profiling Tool is availableAnonymous
September 26, 2008
Perforator and Visual Profiler crash on Vista Sp1 and Xp Sp3, please fix before post download: System.Windows.Markup.XamlParseException was unhandled Message="Impossibile assegnare il valore 'System.Windows.Data.BindingExpression' alla proprietà 'BorderThickness' dell'oggetto 'System.Windows.Controls.Border'. La stringa '1,1,0,0' non può essere convertita in Length. Errore in corrispondenza dell'oggetto 'System.Windows.Data.Binding'." Source="PresentationFramework" LineNumber=0 LinePosition=0 NameContext="BorderThickness" StackTrace: in System.Windows.Markup.XamlParseException.ThrowException(String message, Exception innerException, Int32 lineNumber, Int32 linePosition, Uri baseUri, XamlObjectIds currentXamlObjectIds, XamlObjectIds contextXamlObjectIds, Type objectType) in System.Windows.Markup.XamlParseException.ThrowException(ParserContext parserContext, Int32 lineNumber, Int32 linePosition, String message, Exception innerException) in System.Windows.Markup.BamlRecordReader.ThrowExceptionWithLine(String message, Exception innerException) in System.Windows.Markup.BamlRecordReader.SetDependencyComplexProperty(Object currentTarget, BamlAttributeInfoRecord attribInfo, Object o) in System.Windows.Markup.BamlRecordReader.SetPropertyValueToParent(Boolean fromStartTag, Boolean& isMarkupExtension) in System.Windows.Markup.BamlRecordReader.ReadElementEndRecord(Boolean fromNestedBamlRecordReader) in System.Windows.Markup.BamlRecordReader.ReadRecord(BamlRecord bamlRecord) in System.Windows.StyleHelper.LoadOptimizedTemplateContent(DependencyObject container, ParserContext parserContext, OptimizedTemplateContent optimizedTemplateContent, FrameworkTemplate frameworkTemplate, IComponentConnector componentConnector, IStyleConnector styleConnector, List1 affectedChildren, UncommonField1 templatedNonFeChildrenField) in System.Windows.FrameworkTemplate.LoadContent(DependencyObject container, List1 affectedChildren, UncommonField1 templatedNonFeChildrenField) in System.Windows.StyleHelper.ApplyTemplateContent(UncommonField1 dataField, DependencyObject container, FrameworkElementFactory templateRoot, Int32 lastChildIndex, HybridDictionary childIndexFromChildID, FrameworkTemplate frameworkTemplate) in System.Windows.FrameworkTemplate.ApplyTemplateContent(UncommonField1 templateDataField, FrameworkElement container) in System.Windows.FrameworkElement.ApplyTemplate() in System.Windows.FrameworkElement.MeasureCore(Size availableSize) in System.Windows.UIElement.Measure(Size availableSize) in System.Windows.Controls.Grid.MeasureCell(Int32 cell, Boolean forceInfinityV) in System.Windows.Controls.Grid.MeasureCellsGroup(Int32 cellsHead, Size referenceSize, Boolean ignoreDesiredSizeU, Boolean forceInfinityV) in System.Windows.Controls.Grid.MeasureOverride(Size constraint) in System.Windows.FrameworkElement.MeasureCore(Size availableSize) in System.Windows.UIElement.Measure(Size availableSize) in MS.Internal.Helper.MeasureElementWithSingleChild(UIElement element, Size constraint) in System.Windows.Controls.ContentPresenter.MeasureOverride(Size constraint) in System.Windows.FrameworkElement.MeasureCore(Size availableSize) in System.Windows.UIElement.Measure(Size availableSize) in System.Windows.Controls.Control.MeasureOverride(Size constraint) in System.Windows.FrameworkElement.MeasureCore(Size availableSize) in System.Windows.UIElement.Measure(Size availableSize) in System.Windows.Controls.Decorator.MeasureOverride(Size constraint) in System.Windows.FrameworkElement.MeasureCore(Size availableSize) in System.Windows.UIElement.Measure(Size availableSize) in System.Windows.Controls.Grid.MeasureOverride(Size constraint) in System.Windows.FrameworkElement.MeasureCore(Size availableSize) in System.Windows.UIElement.Measure(Size availableSize) in System.Windows.ContextLayoutManager.UpdateLayout() in System.Windows.ContextLayoutManager.UpdateLayoutCallback(Object arg) in System.Windows.Media.MediaContext.InvokeOnRenderCallback.DoWork() in System.Windows.Media.MediaContext.FireInvokeOnRenderCallbacks() in System.Windows.Media.MediaContext.RenderMessageHandlerCore(Object resizedCompositionTarget) in System.Windows.Media.MediaContext.RenderMessageHandler(Object resizedCompositionTarget) in System.Windows.Threading.ExceptionWrapper.InternalRealCall(Delegate callback, Object args, Boolean isSingleParameter) in System.Windows.Threading.ExceptionWrapper.TryCatchWhen(Object source, Delegate callback, Object args, Boolean isSingleParameter, Delegate catchHandler) in System.Windows.Threading.Dispatcher.WrappedInvoke(Delegate callback, Object args, Boolean isSingleParameter, Delegate catchHandler) in System.Windows.Threading.DispatcherOperation.InvokeImpl() in System.Windows.Threading.DispatcherOperation.InvokeInSecurityContext(Object state) in System.Threading.ExecutionContext.runTryCode(Object userData) in System.Runtime.CompilerServices.RuntimeHelpers.ExecuteCodeWithGuaranteedCleanup(TryCode code, CleanupCode backoutCode, Object userData) in System.Threading.ExecutionContext.RunInternal(ExecutionContext executionContext, ContextCallback callback, Object state) in System.Threading.ExecutionContext.Run(ExecutionContext executionContext, ContextCallback callback, Object state) in System.Windows.Threading.DispatcherOperation.Invoke() in System.Windows.Threading.Dispatcher.ProcessQueue() in System.Windows.Threading.Dispatcher.WndProcHook(IntPtr hwnd, Int32 msg, IntPtr wParam, IntPtr lParam, Boolean& handled) in MS.Win32.HwndWrapper.WndProc(IntPtr hwnd, Int32 msg, IntPtr wParam, IntPtr lParam, Boolean& handled) in MS.Win32.HwndSubclass.DispatcherCallbackOperation(Object o) in System.Windows.Threading.ExceptionWrapper.InternalRealCall(Delegate callback, Object args, Boolean isSingleParameter) in System.Windows.Threading.ExceptionWrapper.TryCatchWhen(Object source, Delegate callback, Object args, Boolean isSingleParameter, Delegate catchHandler) in System.Windows.Threading.Dispatcher.WrappedInvoke(Delegate callback, Object args, Boolean isSingleParameter, Delegate catchHandler) in System.Windows.Threading.Dispatcher.InvokeImpl(DispatcherPriority priority, TimeSpan timeout, Delegate method, Object args, Boolean isSingleParameter) in System.Windows.Threading.Dispatcher.Invoke(DispatcherPriority priority, Delegate method, Object arg) in MS.Win32.HwndSubclass.SubclassWndProc(IntPtr hwnd, Int32 msg, IntPtr wParam, IntPtr lParam) in MS.Win32.UnsafeNativeMethods.DispatchMessage(MSG& msg) in System.Windows.Threading.Dispatcher.PushFrameImpl(DispatcherFrame frame) in System.Windows.Threading.Dispatcher.PushFrame(DispatcherFrame frame) in System.Windows.Threading.Dispatcher.Run() in System.Windows.Application.RunDispatcher(Object ignore) in System.Windows.Application.RunInternal(Window window) in System.Windows.Application.Run(Window window) in System.Windows.Application.Run() in Microsoft.WpfPerformance.WpfPerformanceMain.StartApplication() in Microsoft.WpfPerformance.WpfPerformanceMain.Main() InnerException: System.FormatException Message="La stringa '1,1,0,0' non può essere convertita in Length." Source="PresentationFramework" StackTrace: in System.Windows.LengthConverter.FromString(String s, CultureInfo cultureInfo) in System.Windows.ThicknessConverter.FromString(String s, CultureInfo cultureInfo) in System.Windows.ThicknessConverter.ConvertFrom(ITypeDescriptorContext typeDescriptorContext, CultureInfo cultureInfo, Object source) in System.ComponentModel.TypeConverter.ConvertFrom(Object value) in Microsoft.WpfPerformance.Data.ThicknessMaskConverter.Convert(Object value, Type targetType, Object parameter, CultureInfo culture) in System.Windows.Data.BindingExpression.TransferValue(Object newValue, Boolean isASubPropertyChange) in System.Windows.Data.BindingExpression.Activate(Object item) in System.Windows.Data.BindingExpression.AttachToContext(AttachAttempt attempt) in System.Windows.Data.BindingExpression.AttachOverride(DependencyObject target, DependencyProperty dp) in System.Windows.Data.BindingExpressionBase.Attach(DependencyObject target, DependencyProperty dp) in System.Windows.Data.BindingExpressionBase.OnAttach(DependencyObject d, DependencyProperty dp) in System.Windows.StyleHelper.GetInstanceValue(UncommonField`1 dataField, DependencyObject container, FrameworkElement feChild, FrameworkContentElement fceChild, Int32 childIndex, DependencyProperty dp, Int32 i, EffectiveValueEntry& entry) in System.Windows.TemplateApplicationHelper.SetDependencyValueCore(DependencyObject dependencyObject, DependencyProperty dp, Object value) in System.Windows.Markup.BamlRecordReader.SetDependencyValue(DependencyObject dependencyObject, DependencyProperty dependencyProperty, Object value) in System.Windows.Markup.BamlRecordReader.SetDependencyComplexProperty(Object currentTarget, BamlAttributeInfoRecord attribInfo, Object o) InnerException:Anonymous
October 01, 2008
Hi, i've the same problem with VS2008SP1 and Vista SP1. Any solution?Anonymous
October 02, 2008
I have same problem in my computer, I have VS2008 SP1, VistaAnonymous
October 10, 2008
Some folks reported issues with x64 & with x86 on non-US PCs with our first post . On 10/9/2008 weAnonymous
October 27, 2008
Thinking about profiling your WPF applications to find out where the performance bottlenecks are? CheckAnonymous
November 05, 2008
Last week was our big PDC conference, and I've been busy catching up back at work this week.  IAnonymous
November 05, 2008
Last week was our big PDC conference, and I've been busy catching up back at work this week.  I'mAnonymous
January 17, 2009
Few people asked me for the public download location of our WPF Performance Suite. On 9/25/2008, we updated