SpicIE: How to debug/trace a SpicIE plug-in
Plug-in development is not easy because always your code runs inside Internet Explorer.
Sometimes the code behaves different in Visual Studio debugger and in undebugged Internet Explorer environment.
I try to list some of my best practices of SpicIE plug-in development.
Debug settings
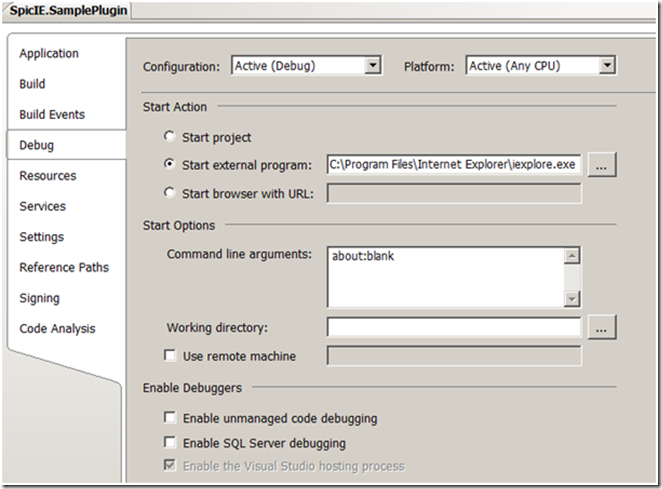
To successfully debug your plug-in with Visual Studio the project settings has to be set as follows.
Internet Explorer has to be set as external startup program. Additional you have to enter a start url as command line argument. The simplest start url you can enter is “about:blank”.
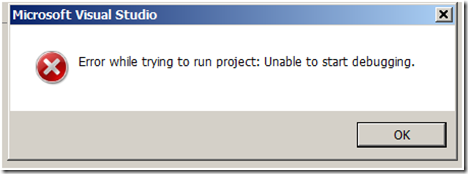
Without a start url you will get the error message “Error while trying to run project: Unable to start debugging”.
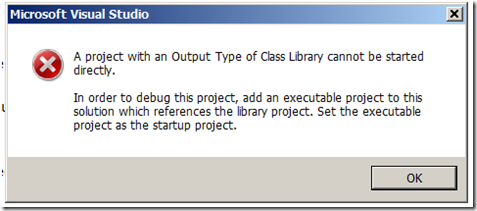
If you get from Visual Studio the error message “A project with an Output Type of Class Library cannot be started directly …” you have to ensure that your project debug setting are as displayed above.
Tracing
One useful help to develop and debug SpicIE plug-ins may be the build-in trace functionality. The class SpicIE.Host has a public static property TraceSink. This property is an instance of a System.Diagnostics.TraceSource class (https://msdn.microsoft.com/en-us/library/system.diagnostics.tracesource.aspx ).
You can use the method “TraceInformation” or “TraceEvent” to dump out messages. The output of the trace statements looks in DebugView as follows.
Tip: If you use DebugView the difference between the timestamps could be interpreted for a kind of profiling.
If you want to have a trace file output for the TraceSink you have to configure your plug-in. Following config file shows how it could look like.
 <?xml version="1.0" encoding="utf-8" ?>
<configuration>
  <appSettings>
    <add key="TraceLog" value="C:\temp\TextWriterOutput.log"/>
    <add key="TraceLevel" value="All"/>
  </appSettings>
  <system.diagnostics>
    <trace autoflush="true" ></trace>
  </system.diagnostics>
</configuration>
Starting without Visual Studio debugger
If you want to test your SpicIE plug-in without Visual Studio you have to ensure that the plug-in is registered correct.
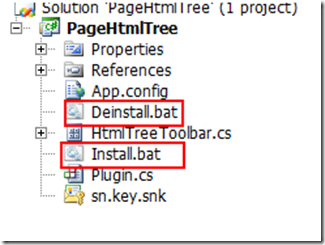
The SpicIE project template offers two batch files for registring and deregistring your plug-in. Install.bat installs your plug-in. Deinstall.bat deinstall your plug-in.
Tip: If you look in the install.bat you see that the code first try to install a “bin\release\” versions of your plug-in. If you want to register you “bin\debug” version of your SpicIE plugin you have to delete the “bin\release” version first!
To avoid problems with debug and release version you can put a trace statement in your code like follows.
        public HtmlTreeToolbar()
        {
            try
            {
#if DEBUG
                Host.TraceSink.TraceInformation(string.Format("HtmlTreeToolbar.HtmlTreeToolbar - DEBUG {0} - {1}",
                    System.Reflection.Assembly.GetExecutingAssembly().FullName, DateTime.Now.TimeOfDay.ToString()));
#else
                 Host.TraceSink.TraceInformation(string.Format("HtmlTreeToolbar.HtmlTreeToolbar - RELEASE {0} - {1}",
                    System.Reflection.Assembly.GetExecutingAssembly().FullName, DateTime.Now.TimeOfDay.ToString()));
#endif
The corresponding output to that code in the trace file looks as follows.
[4752] SpicIE Information: 0 :
[4752] HtmlTreeToolbar.HtmlTreeToolbar - DEBUG PageHtmlTree, Version=1.0.0.0, Culture=neutral, PublicKeyToken=ec146fd6848c0024 - 06:02:38.4148906
Good testing … GunnarD
Comments
Anonymous
March 24, 2009
PingBack from http://www.anith.com/?p=22380Anonymous
March 25, 2009
The comment has been removedAnonymous
March 25, 2009
WebInternetExplorerGlobalVariableBlowupsInternetExplorerApplicationCompatibilityV...


