JS: Improve performance when starting IE using Visual Studio
- When developing web sites in VS, I always start IE by pressing F5 or by right-clicking on the HTML page and clicking on "View in Browser".
- Recently, I was experimenting with HTML5 code to copy the frames of an MP4 video, reverse the frame data and render it back on a canvas.
- The code uses requestAnimationFrame to process the frames and also displays the achieved frames per second (fps).
- This is what I got:

- Only 4 fps. To analyze the cause, I used xperf as follows:
- Open a CMD window with admin rights.
- Set environment variables:
- set _NT_SYMBOL_PATH=SRV*C:\websymbols*https://msdl.microsoft.com/downloads/symbols
- set _NT_SYMCACHE_PATH=C:\websymbols
- Open the web site using IE.
- Run:
- xperf -on base
- ... profiling occurs here, let it run for a few seconds ...
- xperf -d trace.etl
- ... trace file gets saved ...
- Open the trace file in the viewer:
- xperf trace.etl
- In the viewer:
- Click on "Trace --> Load Symbols"
- Open frame: "CPU Sampling by Process --> iexplorer.exe (Thread ID that shows high CPU usage)"
- Select graph area with high CPU usage, then right-click on it and click on "Summary Table"
- Wait for symbols to load and window to appear:
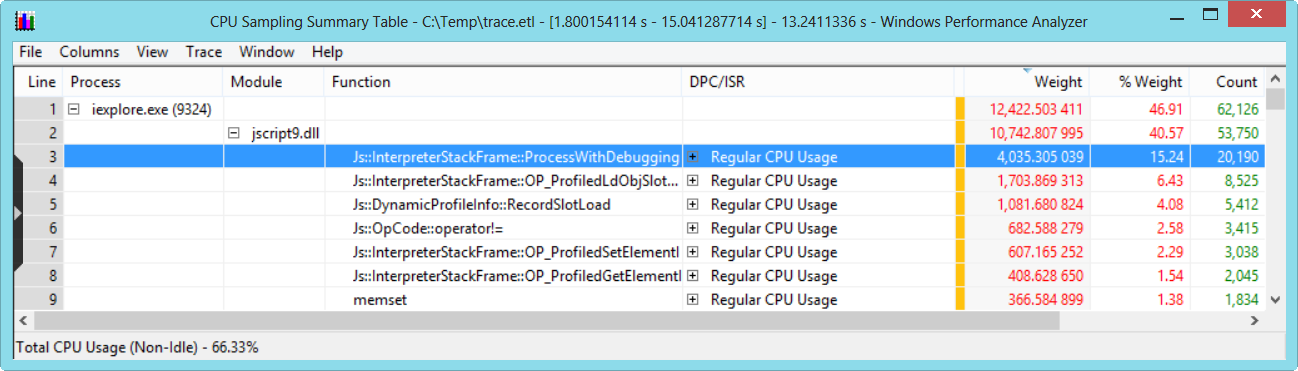
- Sort the table by clicking on the Weight column.
- The screen shot shows that 40.57% of the CPU capacity was spent in the jscript9.dll (Chakra, IE's JS engine) and 15.24% making function calls to "Js::InterpreterStackFrame::ProcessWithDebugging".
- "ProcessWithDebugging" indicates that debugging is taking place, thus adding an overhead to the execution.
- To test the JS code in IE in "release mode", you cannot set the VS build to "Release" as it will make no difference for the client code.
- Instead, keep the IE window open and just pause the JS execution, e.g. by pressing some button that you can add or pausing the video.
- Then open a fresh instance of IE: On Windows 7 or 8, right-click on the IE icon and then click on the Internet Explorer icon on the context menu.
- Copy the URL of the first IE window to the fresh window and see what happens:

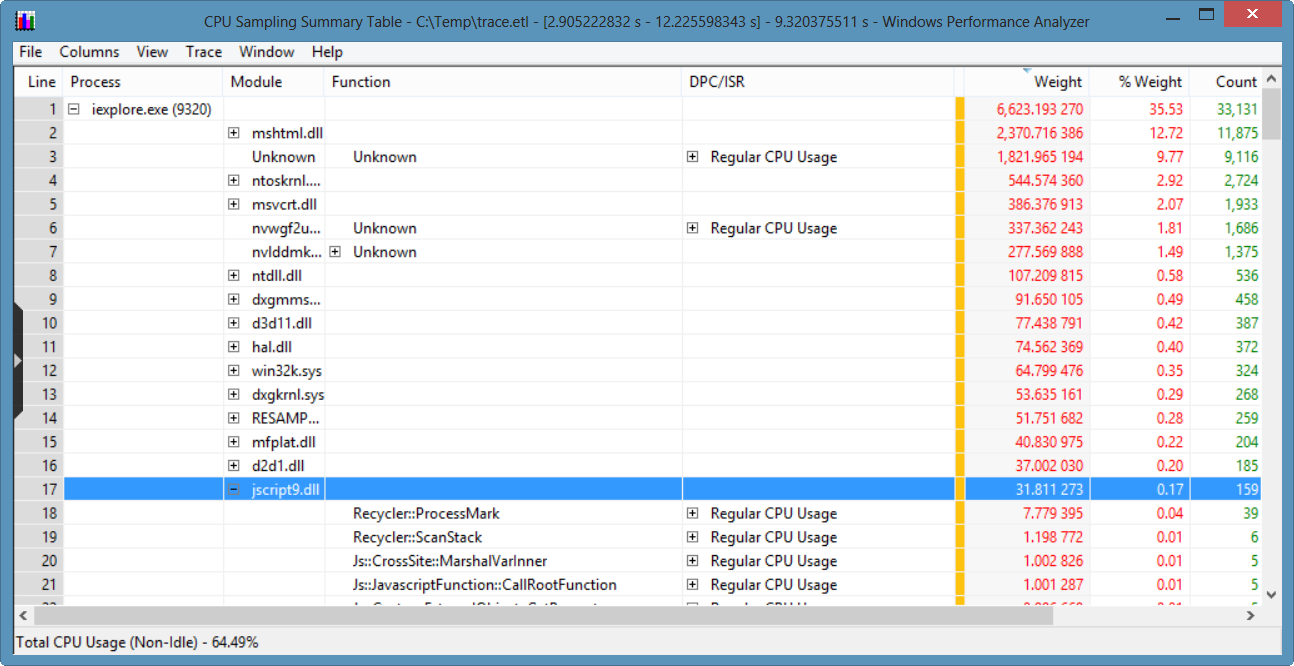
- Now the code reaches 54 fps (of 60 fps max.)!
- Taking a look at the trace of this fresh window shows that the JS execution time is now almost insignificant:
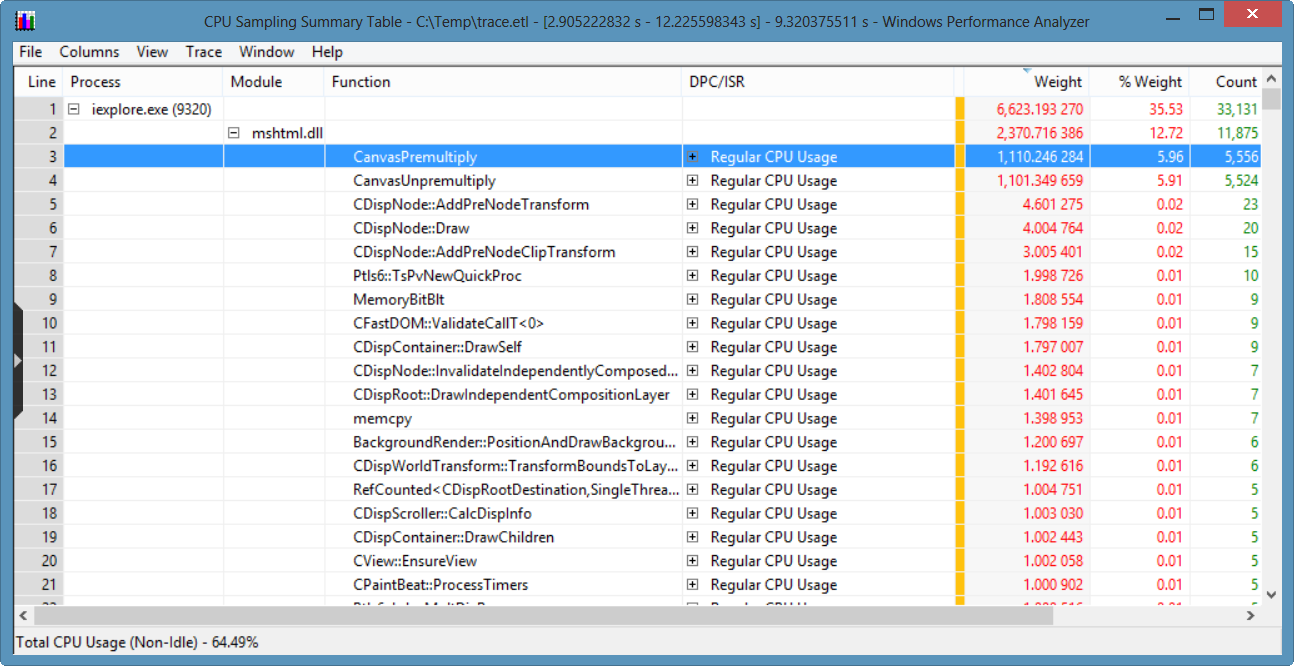
- Instead, most of the time is now being spent in the canvas doing matrix operations:
- Comparison of performance difference of the code in my article "JS: Dots are bad, M'kay?":
IE started from VS
array.length: 5881
len: 4678
Math.floor: 6537
| 0: 4566
document not cached: 6452
document cached: 2831
Fresh IE started outside of VS
array.length: 786
len: 664
Math.floor: 869
| 0: 714
document not cached: 3729
document cached: 44
Summary: When doing something that needs JS performance, start a fresh IE and your code may run up to 100 times faster!
Comments
Anonymous
January 07, 2013
Visual Studio should just provide a better way to disable javascript debugging. Since VS2010 Javascript debugging is always enabled when IE is used and the only way to disable it is to enable SilverLight debugging in the web project. For VS2008 there where workaround to disable the Javascript debugging. But these don't work anymore since VS2010.Anonymous
January 18, 2013
@urk_forever: This looks like the feature you are asking for, please feel free to vote for it: visualstudio.uservoice.com/.../2267061-add-a-start-without-debugging-option-for-individua