DataViews + Visifire =Silverlight Charting Power
 Hi everyone, Jon here again with a great tip on visualizing your data. In my Plotting Your Data Using Virtual Earth post I showed you how to use the DataView to generate javascript as well as standard HTML markup, yielding a map that plotted data. This time I will show you how to make great looking Silverlight graphs of your data using the same technique combined with Visifire. Visifire is a set of open source data visualization tools that provides a variety of chart types that are easily created with a little JavaScript, XML and HTML. Here is some sample markup that will produce a nice pie chart:
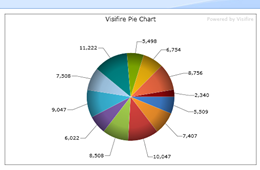
<div id="myChart" align="center">
<script type="text/javascript" src="product/Visifire.js" mce_src="product/Visifire.js"></script>
<script type="text/javascript">
var xmlString =
+ ' <vc:Chart xmlns:vc="clr-namespace:Visifire.Charts;assembly=Visifire.Charts"'
+ ' Theme="Theme1" AnimationType="Type4" >'
+ ' <vc:Title Text="Visifire Pie Chart"/>'
+ ' <vc:DataSeries RenderAs="Pie" ShowInLegend="False" Bevel="False">'
+ ' <vc:DataPoint AxisLabel="Jan" YValue="5509"/>'
+ ' <vc:DataPoint AxisLabel="Feb" YValue="7047"/>'
+ ' <vc:DataPoint AxisLabel="Mar" YValue="10047"/>'
+ ' <vc:DataPoint AxisLabel="Apr" YValue="8508"/>'
+ ' <vc:DataPoint AxisLabel="May" YValue="6022"/>'
+ ' <vc:DataPoint AxisLabel="Jun" YValue="9047"/>'
+ ' <vc:DataPoint AxisLabel="Jul" YValue="7508"/>'
+ ' <vc:DataPoint AxisLabel="Aug" YValue="11222"/>'
+ ' <vc:DataPoint AxisLabel="Sep" YValue="5498"/>'
+ ' <vc:DataPoint AxisLabel="Oct" YValue="6754"/>'
+ ' <vc:DataPoint AxisLabel="Nov" YValue="8756"/>'
+ ' <vc:DataPoint AxisLabel="Dec" YValue="2340"/>'
+ ' </vc:DataSeries>'
+ ' </vc:Chart>'
+ '';
var vChart = new Visifire('product/Visifire.xap',500,300);
vChart.setDataXml(xmlString);
vChart.render("myChart");
</script>
The basic parts that we need for a page to have a chart are:
1. The Visifire.js and Visifire.xap files copied to a location on your web server. I used the same folder as my sample page.
2. The '<script type="text/javascript" src="product/Visifire.js" mce_src="product/Visifire.js"></script>', which loads all the visualization tools.
3. A JavaScript variable ('xmlString') to hold the XML markup for the chart:
<vc:Chart xmlns:vc="clr-namespace:Visifire.Charts;assembly=Visifire.Charts"
Theme="Theme1" AnimationType="Type4" >
<vc:Title Text="Visifire Pie Chart"/>
<vc:DataSeries RenderAs="Pie" ShowInLegend="False" Bevel="False">
<vc:DataPoint AxisLabel="Jan" YValue="5509"/>
<vc:DataPoint AxisLabel="Feb" YValue="7047"/>
<vc:DataPoint AxisLabel="Mar" YValue="10047"/>
<vc:DataPoint AxisLabel="Apr" YValue="8508"/>
<vc:DataPoint AxisLabel="May" YValue="6022"/>
<vc:DataPoint AxisLabel="Jun" YValue="9047"/>
<vc:DataPoint AxisLabel="Jul" YValue="7508"/>
<vc:DataPoint AxisLabel="Aug" YValue="11222"/>
<vc:DataPoint AxisLabel="Sep" YValue="5498"/>
<vc:DataPoint AxisLabel="Oct" YValue="6754"/>
<vc:DataPoint AxisLabel="Nov" YValue="8756"/>
<vc:DataPoint AxisLabel="Dec" YValue="2340"/>
</vc:DataSeries>
</vc:Chart>
4. An HTML div ('myChart') to hold the chart.
5. Some JavaScript to render the div:
var vChart = new Visifire('product/Visifire.xap',500,300);
vChart.setDataXml(xmlString);
vChart.render("myChart");
Most of the requirements are essentially static, but the part where the dataview comes in handy is for formatting your data into “DataPoints” for the XML input.
For this demo I used a custom SharePoint list which had a “Title” field and a “Value” field (of type number). I downloaded the Visifire package and put the Visifire.js and Visifire.xap into the directory where I was saving my aspx page. I inserted a view of the list onto an aspx page by selecting the “Title” and “Value” columns in the Data Source Details task pane, then dragging the selected fields onto the page. I then turned on Split View so I could see the code for the page. Next, I replaced the first xsl:template entry in the DataFormWebPart with a new template. Here is the original version:
<xsl:template match="/">
<xsl:call-template name="dvt_1"/>
</xsl:template>
Here is the new version:
<xsl:template match="/">
<!-- Load the chart tools -->
<script type="text/javascript" src="Visifire.js" mce_src="Visifire.js"></script>
<!-- Create the JavaScript variable that holds the data to plot. -->
<!-- Note the xsl:for-each statement which loops over all the -->
<!-- list items and creates the necessary DataPoint entries -->
<!-- in the Chart XML. -->
<xsl:text disable-output-escaping="yes"><![CDATA[
<script type="text/javascript">
var xmlString =
' <vc:Chart xmlns:vc="clr-namespace:Visifire.Charts;assembly=Visifire.Charts"'
+ ' Theme="Theme1" AnimationType="Type4" >'
+ ' <vc:Title Text="Visifire Pie Chart"/>'
+ ' <vc:DataSeries RenderAs="Pie" ShowInLegend="False" Bevel="False">'
]]></xsl:text>
<xsl:for-each select="/dsQueryResponse/Rows/Row">
<xsl:text disable-output-escaping="yes"><![CDATA[ + ' <vc:DataPoint AxisLabel="]]></xsl:text>
<xsl:value-of select="./@Title" />
<xsl:text disable-output-escaping="yes"><![CDATA[" YValue="]]></xsl:text>
<xsl:value-of select="@Value" />
<xsl:text disable-output-escaping="yes"><![CDATA["/>']]></xsl:text>
</xsl:for-each>
<xsl:text disable-output-escaping="yes">
<![CDATA[
+ ' </vc:DataSeries>'
+ ' </vc:Chart>';
</script>
]]></xsl:text>
<!-- Create the div to hold the chart and then run -->
<!-- the JavaScript code to actually show the chart. -->
<div id="myChart" style="width:500px;height:300px;">
<script language="javascript" type="text/javascript">
var vChart2 = new Visifire("Visifire.xap");
vChart2.setDataXml(xmlString);
vChart2.render("myChart");
</script>
</div>
</xsl:template>
If you save and preview the page you should now have a really great looking graph. You can experiment with the chart’s XML held in the “xmlString” to create many styles of charts, including all the ones shown in the Visifire gallery and much more. I hope this gives you some great tools to plot your data. Also, don’t forget to check out the Silverlight for SharePoint Blueprint for other ways to integrate Silverlight into your SharePoint sites. Enjoy!
-Jon
Comments
Anonymous
July 20, 2008
PingBack from http://www.fuzzlinks.com/2008/07/20/microsoft-sharepoint-designer-team-blog-dataviews-visifire-silverlight-charting-power/Anonymous
August 01, 2008
Hi Jon, I followed all the instructions given, but i am unable to see your chart sample. It says I need Silverlight to view the chart. Can you please tell requirements to use visifire in my sharepoint site. Thanks.Anonymous
August 11, 2008
Hier habe ich ein paar Tipps zum SharePoint Designer zusammengestellt: Use SharePoint Designer to EmailAnonymous
August 11, 2008
Hier habe ich ein paar Tipps zum SharePoint Designer zusammengestellt: Use SharePoint Designer to EmailAnonymous
August 12, 2008
Hier habe ich ein paar Tipps zum SharePoint Designer zusammengestellt: Use SharePoint Designer to EmailAnonymous
August 14, 2008
Direkter Download: SPPD-102-2008-08-14 Aktuell Feedback Usergruppen ISPA International SharePoint ProfessionalsAnonymous
August 14, 2008
Direkter Download: SPPD-102-2008-08-14 Aktuell Feedback Usergruppen ISPA International SharePoint ProfessionalsAnonymous
September 06, 2008
Live demo on http://www.wssdemo.com/Pages/graph.aspx Regards, IanAnonymous
October 14, 2008
Are there any examples available for another data source besides a Sharepoint List? An example of using these charts in Sharepoint with a SQL Server as a data source would be great!Anonymous
November 24, 2008
Hello How can i do with group view? Lets say I am having a view called "My State" which is grouped by State. I want to display pie or bar chart of total sale of each state? ANy clue DishaAnonymous
September 25, 2009
The comment has been removedAnonymous
July 26, 2010
Jon thx for this. I have a few questions. regarding the xmlstring is it to be replaced by XML returned data I get via the URL below? So would it be something like this var xmlstring = http://<server>/_vti_bin/owssvr.dll?Cmd=Display&List=%7b08CF5763-AB40-4D0A-9A43-13A040D944AE%7d&XMLDATA=TRUE