Show Your Data in a Tag Cloud with XPath Expressions

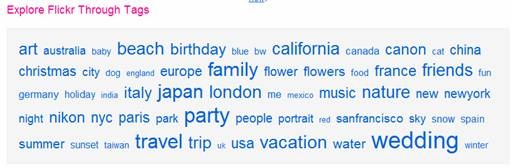
Hi everyone, Jon Campbell here again with another great way to visualize your data in using DataViews. Tag clouds are a popular way to visually show how various terms are related to each other by assigning weights to each term, then using those weights to make the term larger or smaller in relation to other terms. I provided a screenshot from the Explore page on flickr. A quick glance can tell you right away there are many more photos tagged with the term “wedding” than there are with the term “blue”, but there are about as many photos tagged “snow” as there are photos tagged “spain”. After reading this post you will be able to create a tag cloud using your own data.
As with many of my other posts, I am using an xml file as my datasource (though you could use any datasource supported by the DataView). My sample xml file (Sales.xml) includes a list of sales people and their sales numbers for a given period.
<?xml version="1.0" encoding="utf-8" ?>
<dsQueryResponse>
<Rows>
<Row Title="Bob Stevens" Sales="28000"/>
<Row Title="Sally Jones" Sales="75000"/>
<Row Title="Jim Moore" Sales="22000"/>
<Row Title="Rebecca Anderson" Sales="30000"/>
<Row Title="Bill Baily" Sales="36000"/>
<Row Title="Alfredo Marinz" Sales="14000"/>
</Rows>
</dsQueryResponse>
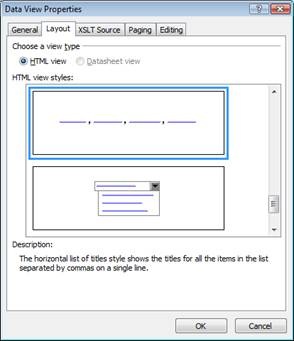
Start by creating the Sales.xml file, then creating a new page and inserting a dataview using that data. Select the DataViewand then click Data View ->Data View Properties, then select the “Layout” tab. There are a number of different styles available, but the style that is closest to the tag cloud we are trying to emulate is the “horizontal list” style.
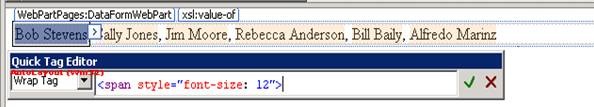
Next, select one of the names in the data view and clickEdit ->Quick tag editor… to bring up the quick tag editor. We want to surround the name with a <span> tag so that we can apply our font styling, so select “wrap tag” from the drop down and then type “<span style=’font-size: 12’>” into the dialog. Click the green checkbox to close the dialog.
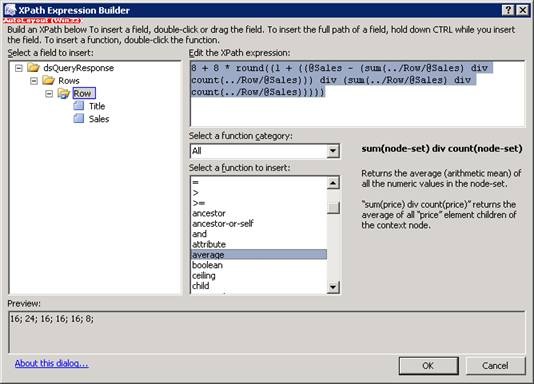
The next task is to figure out how to determine the size of the font to be used. The exact formula will be specific to your data, but for my data I chose to have tags have a font-size of 16 on average. The basic formula is 8 + (8 * (1 + ((S-A) / A)), where S is the sales for the salesperson and A is the average. “1 + (S-A) / A” gives the deviation from the average as a percentage. Multiplying by 8 gives a scaling value. The great thing about the DataView is that it’s based on XSL, and XSL has support for things like summations, rounding, basic math, and more. The final XSL expression for the font size looks like this:
8 + 8 * round((1 + ((@Sales - (sum(../Row/@Sales) div count(../Row/@Sales))) div (sum(../Row/@Sales) div count(../Row/@Sales)))))
Things to note about the XSL expression:
· font-size is an integer, so we will want to round the percentage to a whole number.
· The way we do an average in xsl is to do a summation divided by a count.
· For the current row’s sales are obtained via the current node via @Sales
· The average needs the set of all sales values. Since the expression is currently on a row, the “..” moves to the parent “Rows”, and then the “Row/@Sales” obtains all the sales numbers.
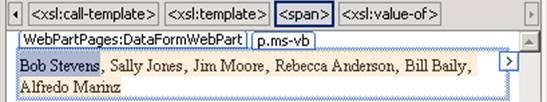
To apply our XPath expression to the font-size CSS attribute, select one of the names in the DataView, then used the tag selector to choose the <span> tag.
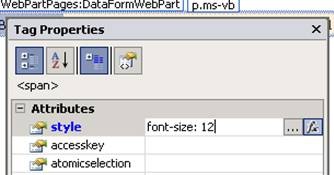
Click Task Panes ->Tag Properties and find the “style” attribute entry. Notice that when you click into the textbox on the right two buttons appear – “…” and “fx”. We want to replace the fixed setting of 12 with a formula, so highlight the “12” and then click the fx button.
You should now be in the XPath Expression builder. I would encourage you to explore the various functions that are available. Since we already figured out what the expression should be, just paste it into the XPath expression text box and hit ok.
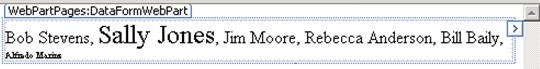
When you get back to the design view you should now have something like this:
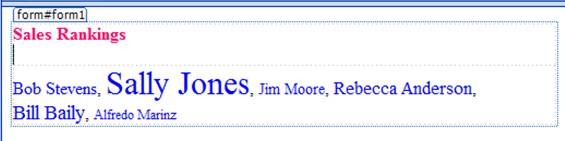
With a little bit of CSS you can easily end up with something pretty close to the flickr example from above.
I hope this is useful for some of you. I’m looking forward to the exciting ways you can find to use DataViews with conditional formatting and XPath Expressions. Enjoy!
Jon
Comments
Anonymous
June 13, 2008
Hi, When I try the expression you mentioned still I don't see the font-size getting changed after applying the function in the Designer. What could be the issue? Shalin ParmarAnonymous
June 13, 2008
Algunos Vinculos interesantes para compartir : 1 - Como generar TAG Clouds con SharePoint Designer /Anonymous
June 17, 2008
Excellent post. Keep these coming.Anonymous
June 17, 2008
Shalin - I just tried to see if I could get the behavior you are seeing. When the font-size style was not properly formed. Specifically, when the "px" part of the font-size expression was malformed then I got the behavior you are seeing. For reference, here is the final value that should be the style for the span tag. font-size: {8 + 8 * round((1 + ((@Sales - (sum(../Row/@Sales) div count(../Row/@Sales))) div (sum(../Row/@Sales) div count(../Row/@Sales)))))}pxAnonymous
June 22, 2008
Hi, The article is great,but i am still finding one problem with weight calculation logic.8 + (8 * (1 + ((S-A) / A)).Though it works fine in some cases,but in some other cases,the tags doesn't dispaly properly.This actually turned out to be because of the fact we are assigning the values with 'px' which are absolute values,instead it should be given in "em"(Relative values).Any ideas on how to convert this logic in "em"Anonymous
June 23, 2008
Amit - You are correct in that my formula didn't take into account all possible values. If you want to use "em" sizing instead then you would want to center around 1 being the norm, so you don't need to scale by 8. em values range from 0-infinity technically, but in reality you probably want something that ranges from 0-10 or so, weighted to be between 0 and 2 most often. the basic 1+ S-A/A logic should be fine as a basis.Anonymous
June 25, 2008
Just in case you are looking for a comercial solution to implement muliple taxonomies for your SharePoint portal (WSS/MOSS), so you don't rely too much on main navigation: SharePartXXL offers an extension with cross-site centrally managed, tree-style categories that can be used in all lists and libraries to categorize the content using different taxonomies, e.g. organizational, by products or geographically. Metadata from categorized content can be shown in dynamic category-based sites for navigation, related items are shown in the items detail view resulting in some kind of browsable corporate knowledge network. In V2.0 tag clouds are announced to be included. Please check it out: http://www.sharepartxxl.com/products/taxonomy/default.aspxAnonymous
June 30, 2008
The comment has been removedAnonymous
July 01, 2008
The comment has been removedAnonymous
August 22, 2008
This is very interesting, I have a question related to this post, how do I create a "tag cloud" from a lookup field? I use the lookup field to tag the articles instead of having a text field.Anonymous
September 05, 2008
AlexD - You should be able to make it work. The XSL will be a little trickier because in my example I had numerical values. In your comment it sounds like you are wanting to count the number of times a lookup references a specific term. You can do it, but you will need to use some custom XSL to generate those counts.Anonymous
July 24, 2009
The comment has been removed