Load Test Execution/Post Run UI Enhancements
This post will describe enhancements to the load test execution/post run UI in the Orcas release of VS.
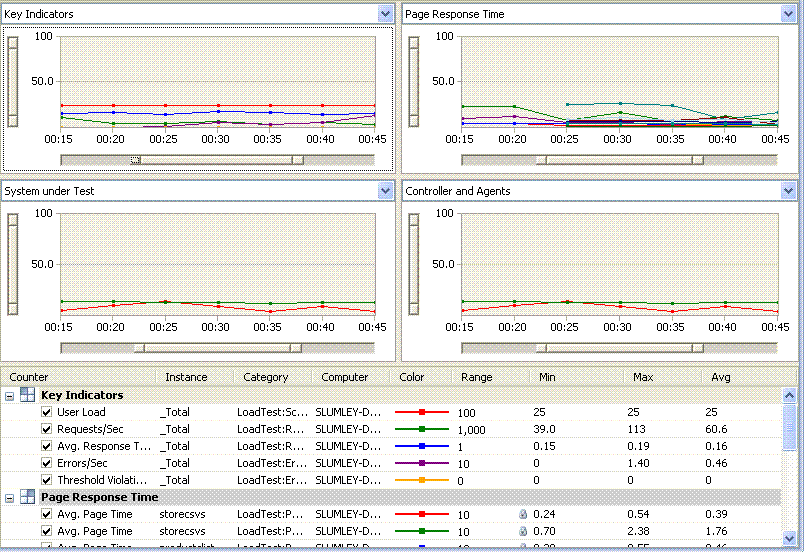
1. Multiple Graphs: The first change will be obvious as soon as you start a load test. You now have the ability to have multiple visible graphs. You can have 1 to 4 graphs visible and in a variety of configurations. This will make it easier to separate counters on to their own graphs, but still be able to view them all at the same time.
For example, you can have the four corner view.
Or you have 2 graphs which are stacked on top of each other.
2. Horizontal Zooming: When you are in the post run UI, you will have a number of zooming options. The default horizontal zooming option is to have all graphs zoom to the same interval. So if you zoom one graph to a particular time slice, all graphs will zoom to the same slice. This is useful when you want to investigate a particular spike on one graph. Since the other graphs change to the same time slice, it is easy to see what the counters on those graphs are doing at the same time. You can also have the horizontal zoom act separately for each graph. Here is a shot of all graphs zoomed to same time slice:
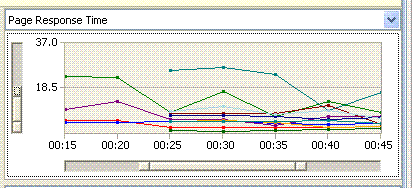
3. Vertical Zooming: Now you can have you graphs zoom vertically. This can be helpful when the graphs activity is mostly in a small range. Notice this graph is both vertically and horizontally zoomed.
4. Multiple Tables: The same way you can have multiple graphs visible at one time, you can also have multiple tables visible at the same time.
5. Predefined Graphs: A common question that we received is what counters are useful to look at. To help answer that question, we have put together 6 predefined graphs which are available for every load test.
a. Key Indicators: Counters such as User Load, Requests / Sec, Avg. Response Time, etc.
b. Page Response Time: The Avg. Page Time counter for each page in the load test is added to this graph.
c. System under Test: This graph will show counters for each machine that you have mapped a counter set to. For example, if you have mapped counter sets to your web servers and SQL servers, this graph will show processor and memory for each of those machines.
d. Controllers and Agents: This shows the health of the test rig.
e. Test Response Time: The Avg. Test Time counter for each test in the load test is added to this graph.
f. Transaction Response Time: The Avg. Response Time counter for each transaction in the load test is added to this graph.
6. Export to Excel or CSV: We have given you the ability to export the raw data for all counters on a given graph to either excel or a csv file. This will allow you create your own custom graphs on the data.
7. Summary report: The summary report gives you summary information about the load test. Checkout this blog post for more info: Summary Report
These features were all available in the Beta1 release of Orcas.
Comments
Anonymous
June 14, 2007
The comment has been removedAnonymous
June 28, 2007
Lot's of new stuff for web, load, and unit tests in Orcas. Follow the links for more info. Web test ·Anonymous
August 17, 2007
Orcas - Visual Studio Team System 2008 - new features coming for Web and Load testing and a feature ofAnonymous
September 21, 2007
Just a quick note as I couldn't find it anywhere during a quick search during my lab. I wanted to seeAnonymous
September 21, 2007
Just a quick note as I couldn't find it anywhere during a quick search during my lab. I wanted toAnonymous
December 19, 2007
Visual Studio Team System for Testers Content Index for Web Tests and Load Tests Getting Started Online


