Logs in Azure Cosmos DB for PostgreSQL
APPLIES TO:
Azure Cosmos DB for PostgreSQL (powered by the Citus database
extension to PostgreSQL)
PostgreSQL database server logs are available for every node of a cluster. You can ship logs to a storage server, or to an analytics service. The logs can be used to identify, troubleshoot, and repair configuration errors and suboptimal performance.
Capture logs
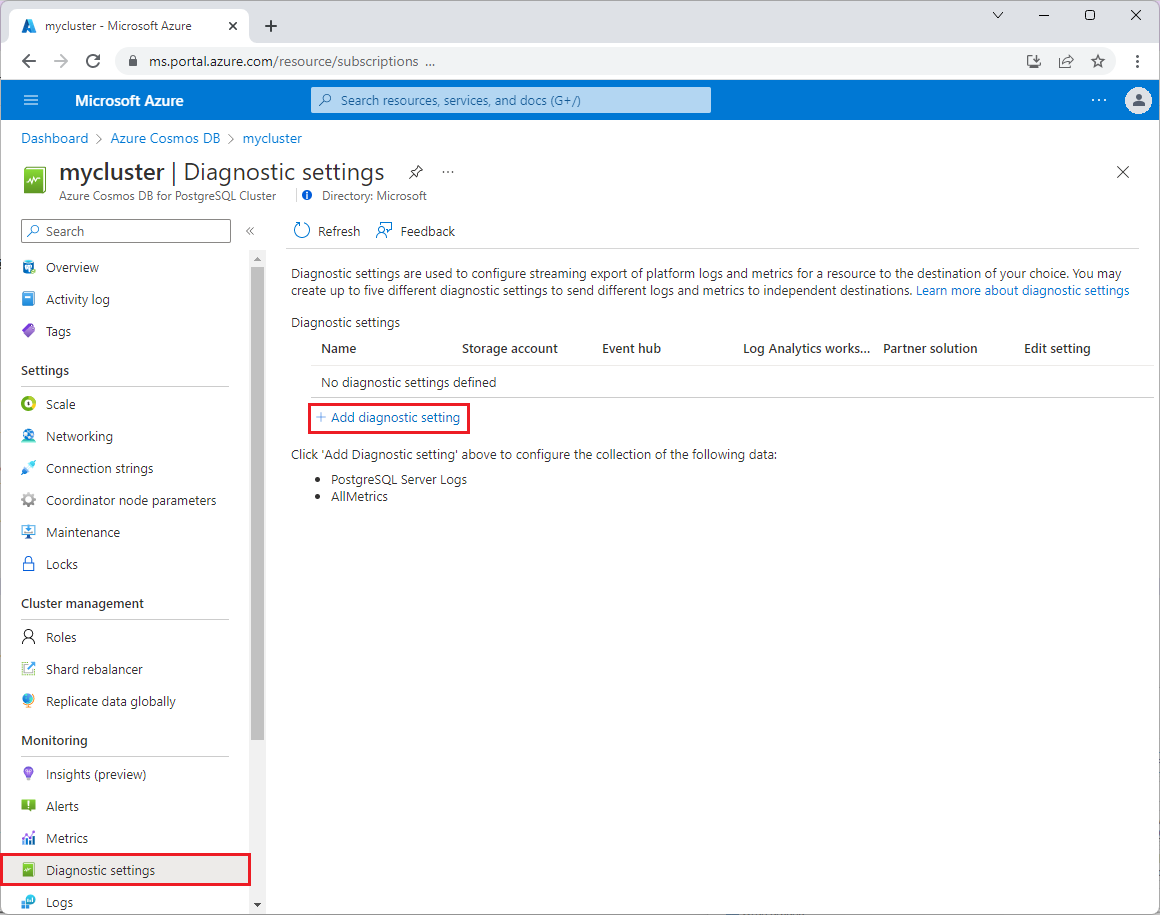
To access PostgreSQL logs for a coordinator or worker node, you have to enable the PostgreSQL Server Logs diagnostic setting. On your cluster's page in the Azure portal, select Diagnostic settings from the left menu, and then select Add diagnostic setting.

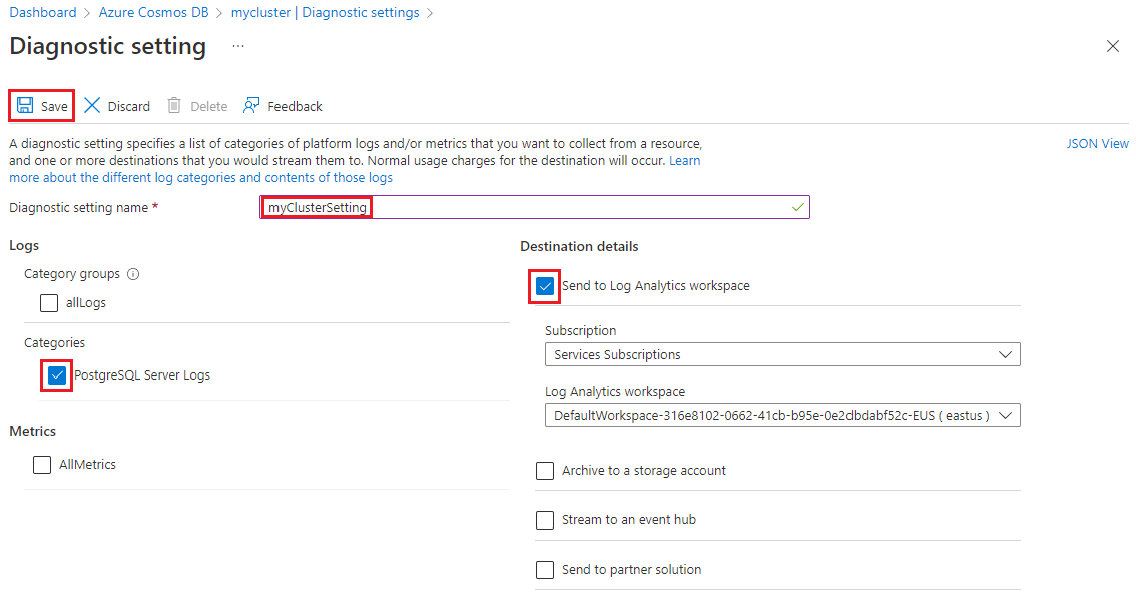
Enter a name for the new diagnostic setting, select the PostgreSQL Server Logs box, and check the Send to Log Analytics workspace box. Then select Save.

View logs
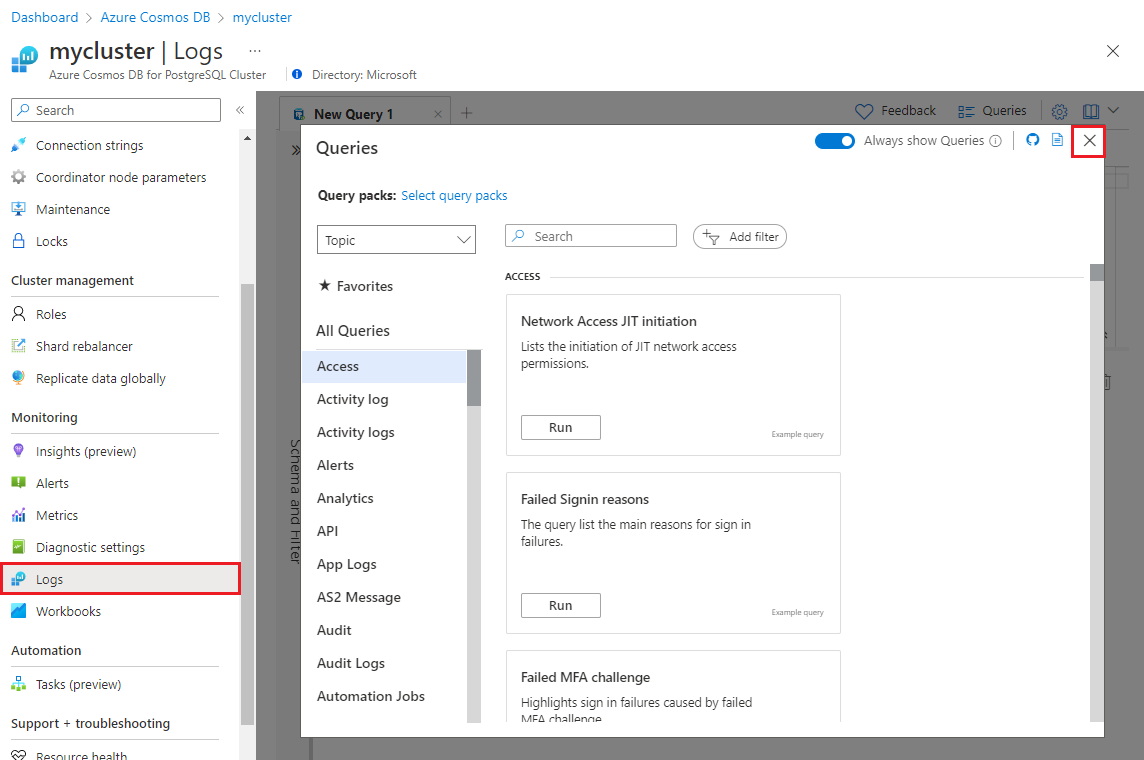
To view and filter the logs, you use Kusto queries. On your cluster's page in the Azure portal, select Logs from the left menu. Close the opening splash screen and the query selection screen.

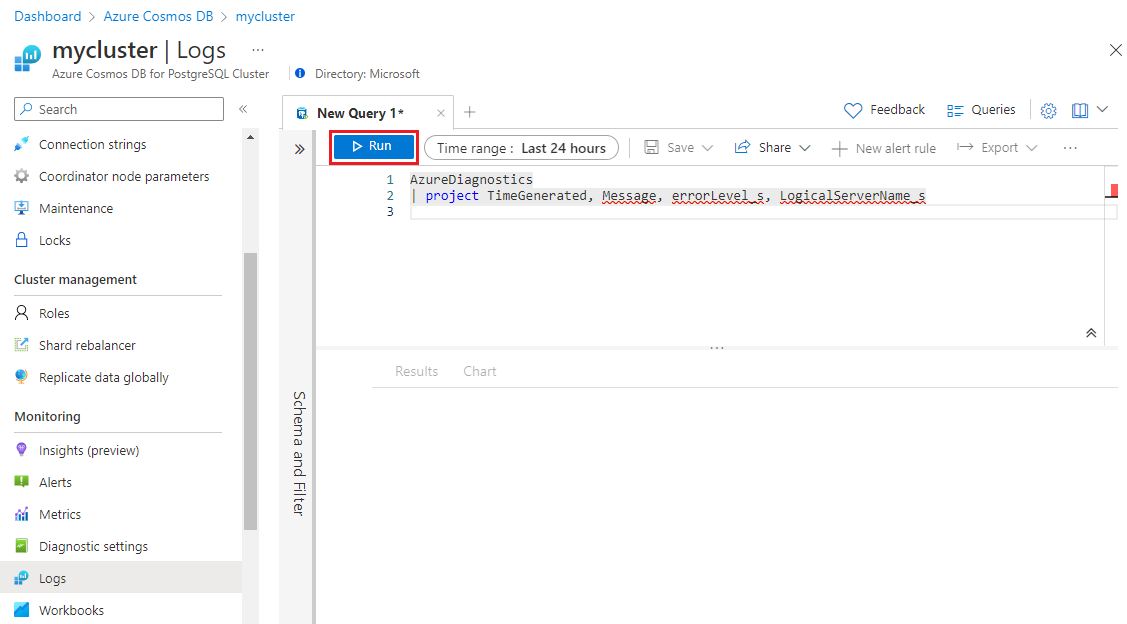
Paste the following query into the query input box, and then select Run.
AzureDiagnostics
| project TimeGenerated, Message, errorLevel_s, LogicalServerName_s

The preceding query lists log messages from all nodes, along with their severity
and timestamp. You can add where clauses to filter the results. For instance,
to see errors from the coordinator node only, filter the error level and server
name like in the following query. Replace the server name with the name of your server.
AzureDiagnostics
| project TimeGenerated, Message, errorLevel_s, LogicalServerName_s
| where LogicalServerName_s == 'example-cluster-c'
| where errorLevel_s == 'ERROR'
The coordinator node name has the suffix -c and worker nodes are named
with a suffix of -w0, -w1, and so on.
The Azure logs can be filtered in different ways. Here's how to find logs within the past day whose messages match a regular expression.
AzureDiagnostics
| where TimeGenerated > ago(24h)
| order by TimeGenerated desc
| where Message matches regex ".*error.*"