Capture a browser trace for troubleshooting
If you're troubleshooting an issue with Azure DevOps and need to contact Microsoft Support, capture additional information such as a browser trace, step recording, and console output. This data provides important details about what is happening in Azure DevOps when the issue occurs.
A HAR (HTTP Archive) file tracks information between a web browser and a website. It contains detailed performance data about web pages, including resources loaded, time taken for each resource, and any errors encountered. Sharing a HAR file with Microsoft Support can help diagnose and resolve issues more effectively.
Warning
Browser traces often contain sensitive information and might include authentication tokens linked to your identity. Remove any passwords before sharing traces with others. Handle these HAR files with care to ensure the security and privacy of the contained information. Microsoft support uses these traces for troubleshooting purposes only.
Generate HAR file and record browser activity
You can capture this information from Microsoft Edge or Google Chrome. Steps for each browser are shown as follows.
The following steps show how to use the developer tools in Microsoft Edge. For more information, see Microsoft Edge DevTools.
Note
The screenshots in this article show the DevTools in Focus Mode with a vertical Activity Bar. Depending on your settings, your configuration might look different. For more information, see Simplify DevTools using Focus Mode.
In your browser, select F12 > Open DevTools.
Select
 more actions.
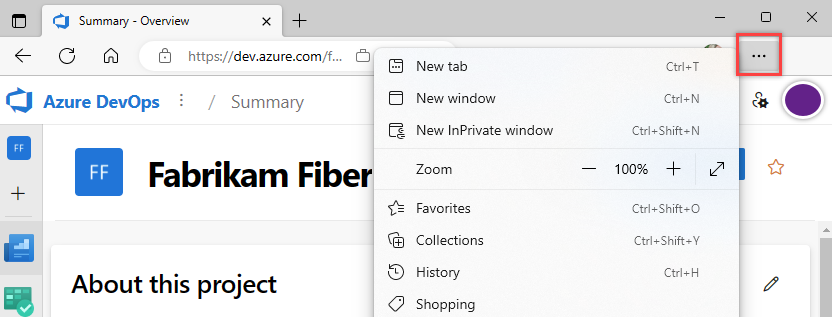
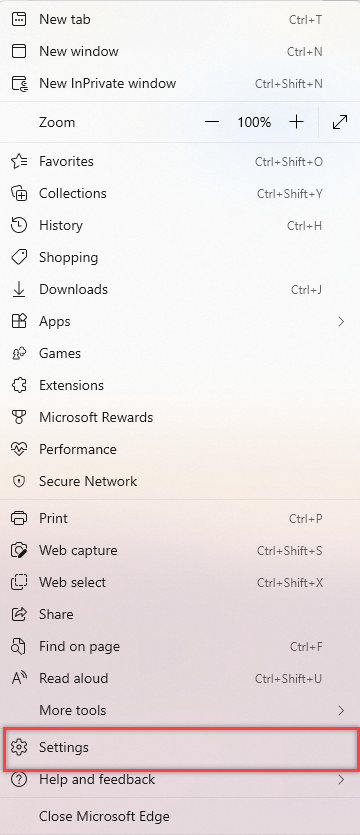
Select Settings.
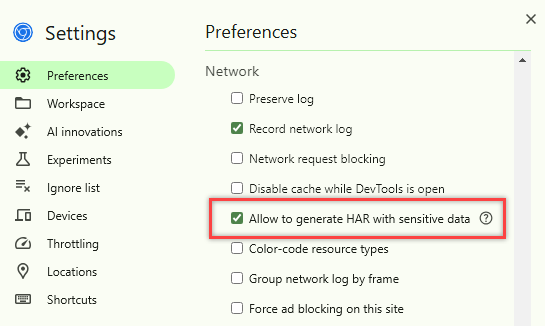
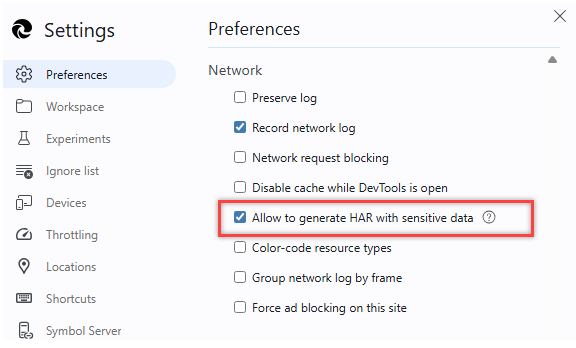
Under Preferences, scroll to the Network section and enter a check in the box next to Allow to generate HAR with sensitive data.
Close the settings menu.
Ensure the Network tab is set to Preserve log and is capturing traffic.

Go to the step before where the issue occurs.
Start recording the steps you take in Azure DevOps, using Steps Recorder.
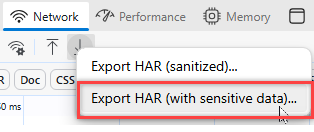
When you're done recording, long press the export button so that it shows a menu. If you only do a short press, a sanitized version of the HAR gets exported, which is missing information needed for troubleshooting.
Select Export HAR (with sensitive data).
(Optional) Uncheck the "Allow to generate HAR with sensitive data" box when you're done.
You have a complete HAR file with the necessary data for troubleshooting.

