Performance Dashboard for SQL database in Microsoft Fabric
Applies to: ✅ SQL database in Microsoft Fabric
The Performance Dashboard in Fabric SQL database displays the performance status of the database and offers varying levels of metrics visibility.
You can use the Performance Dashboard to view database performance metrics, to identify performance bottlenecks, and find solutions to performance issues.
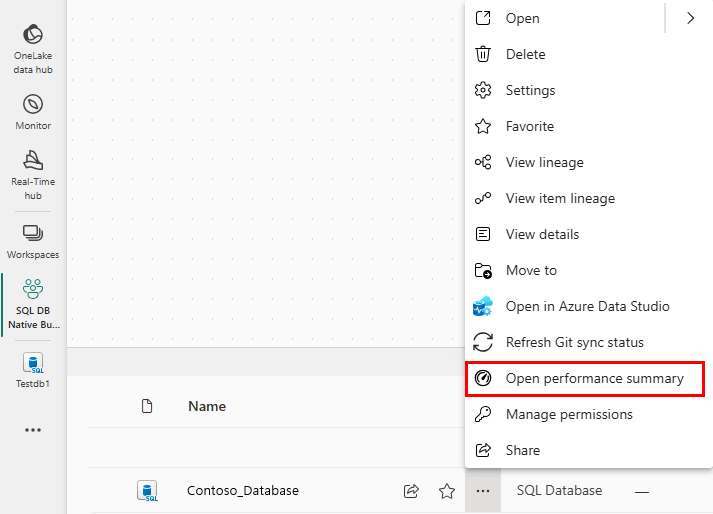
To open the Performance Dashboard for your SQL database in Fabric:
- On the Home toolbar in the Query Editor window, select Performance summary.

- Right-click on the context button (the three dots) in the item view, then select Open performance summary.
Alerts
Automatically generated alerts with preset criteria provide two kinds of notifications:
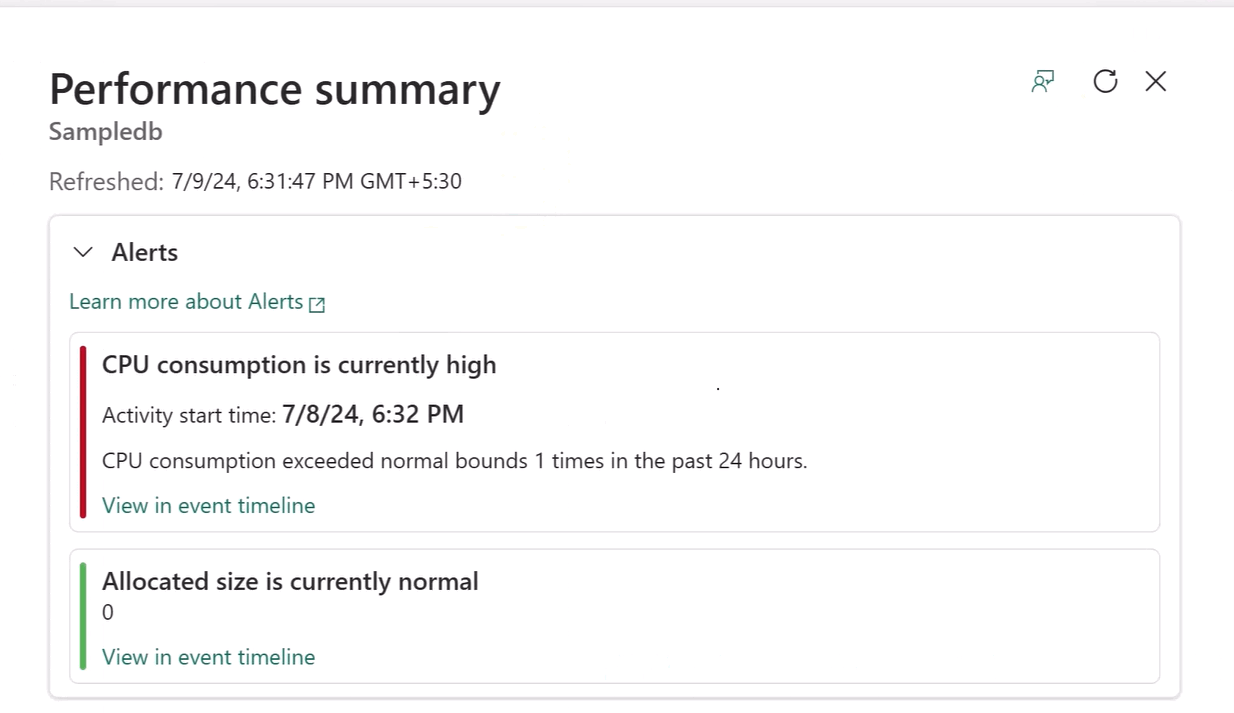
Ongoing Alerts: Raised when the Database is facing a problem, this Alert appears when one of the parameters (CPU, Blocking Queries, or Allocated Size) is in critical state. This alert is represented by a horizontal Notification bar.
Pending Alerts: Stored in the system, this Alert provides alerts that analysis is needed for a database parameter reaching a critical state.
Once you select the link for an alert, the Performance Summary provides a summary of alerts and recent metrics of the database. From here, you can drill into the event timeline for more information.
Performance dashboard graph
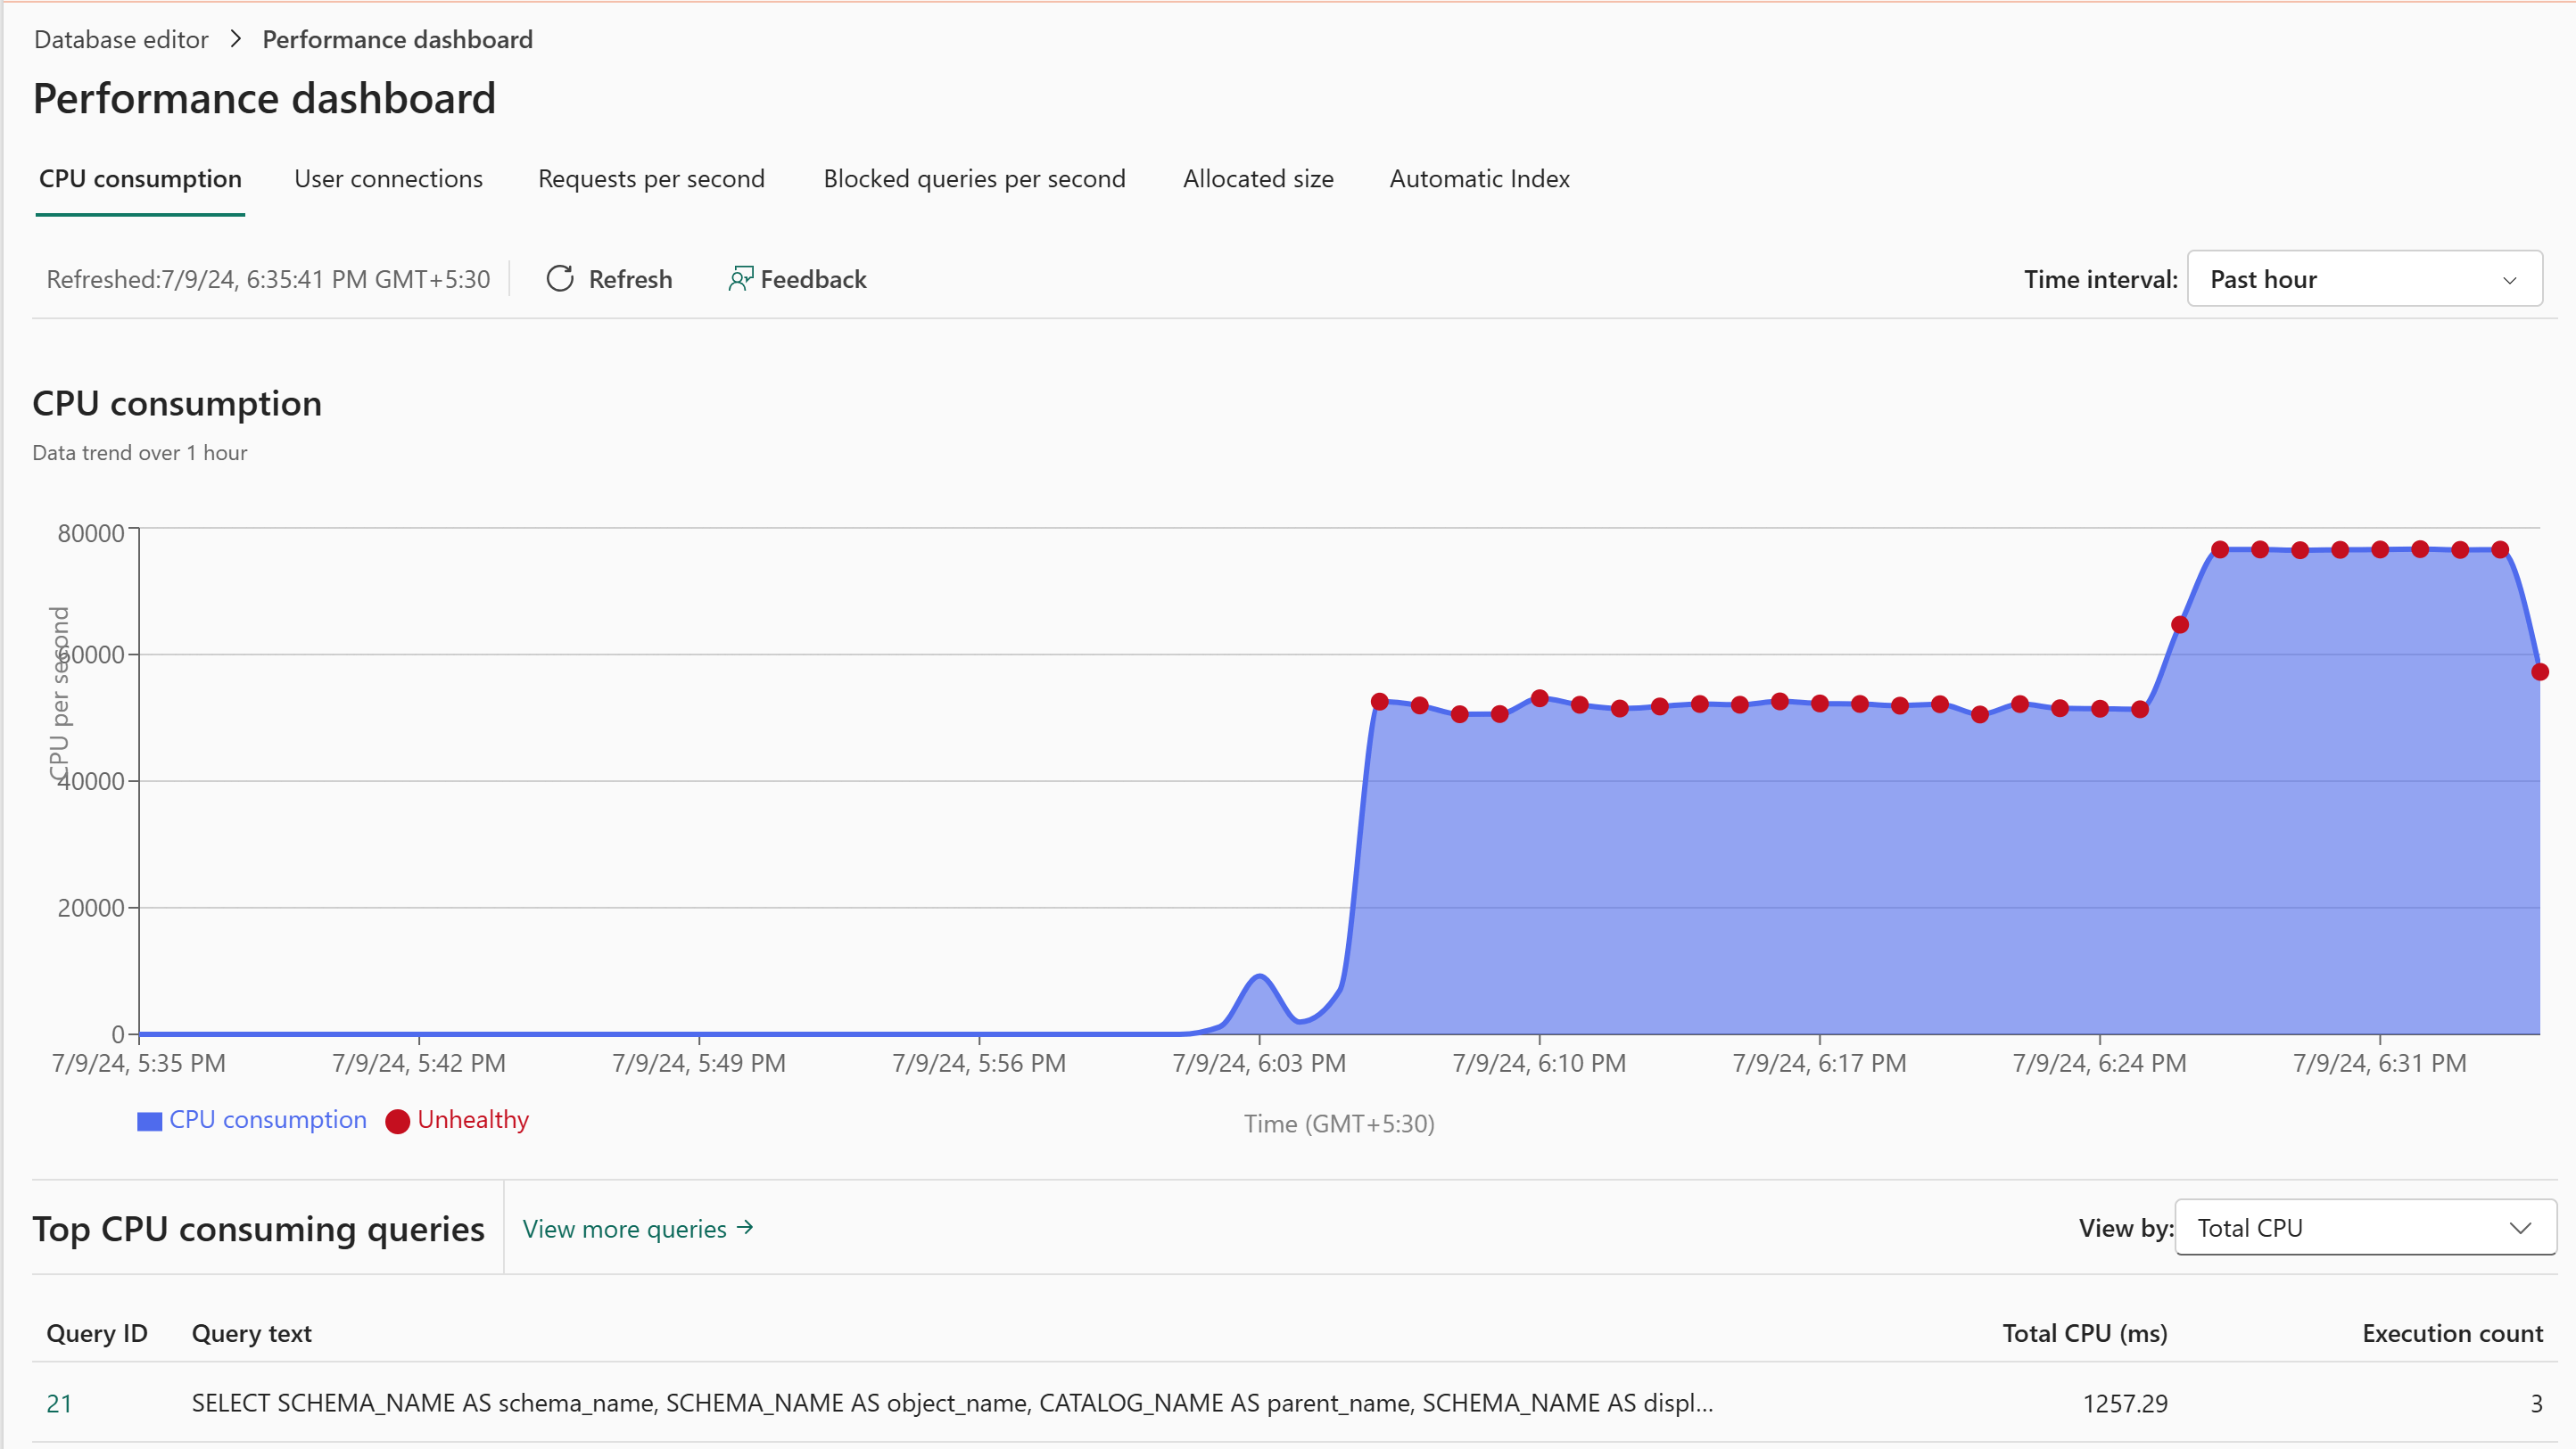
When the database reaches a critical state of CPU consumption (or any other factor which raises an alert), you can see Unhealthy points marked on the CPU consumption tab's graph, marking points where the CPU consumption has crossed the threshold value. The time interval is configurable and defaults to 24 hours.
In the following image, the CPU consumption graph indicates when the database reached a critical state.
Alert threshold criteria
| Tab | Threshold | Criteria |
|---|---|---|
| CPU consumption | 80% of the allotted value | If the monitor finds the CPU above the threshold for more than five minutes. The monitor checks at a frequency of one minute. |
| Allocated Size | 80% of the allotted size | If the monitor finds the size above the threshold for more than five minutes. The monitor checks at a frequency of one minute. |
| Blocked Queries | One Blocked Query | If there is at least one blocked query which has been blocked for more than one minute. The monitor is expected to check this every three minutes. |
Performance dashboard tabs
The following are built-in reporting areas of the Performance Dashboard.
CPU consumption
The CPU consumption graph is plotted by vCore seconds. The Top Consuming CPU queries identifies the queries in the desired time interval that have been most responsible for vCore consumption.
User connections
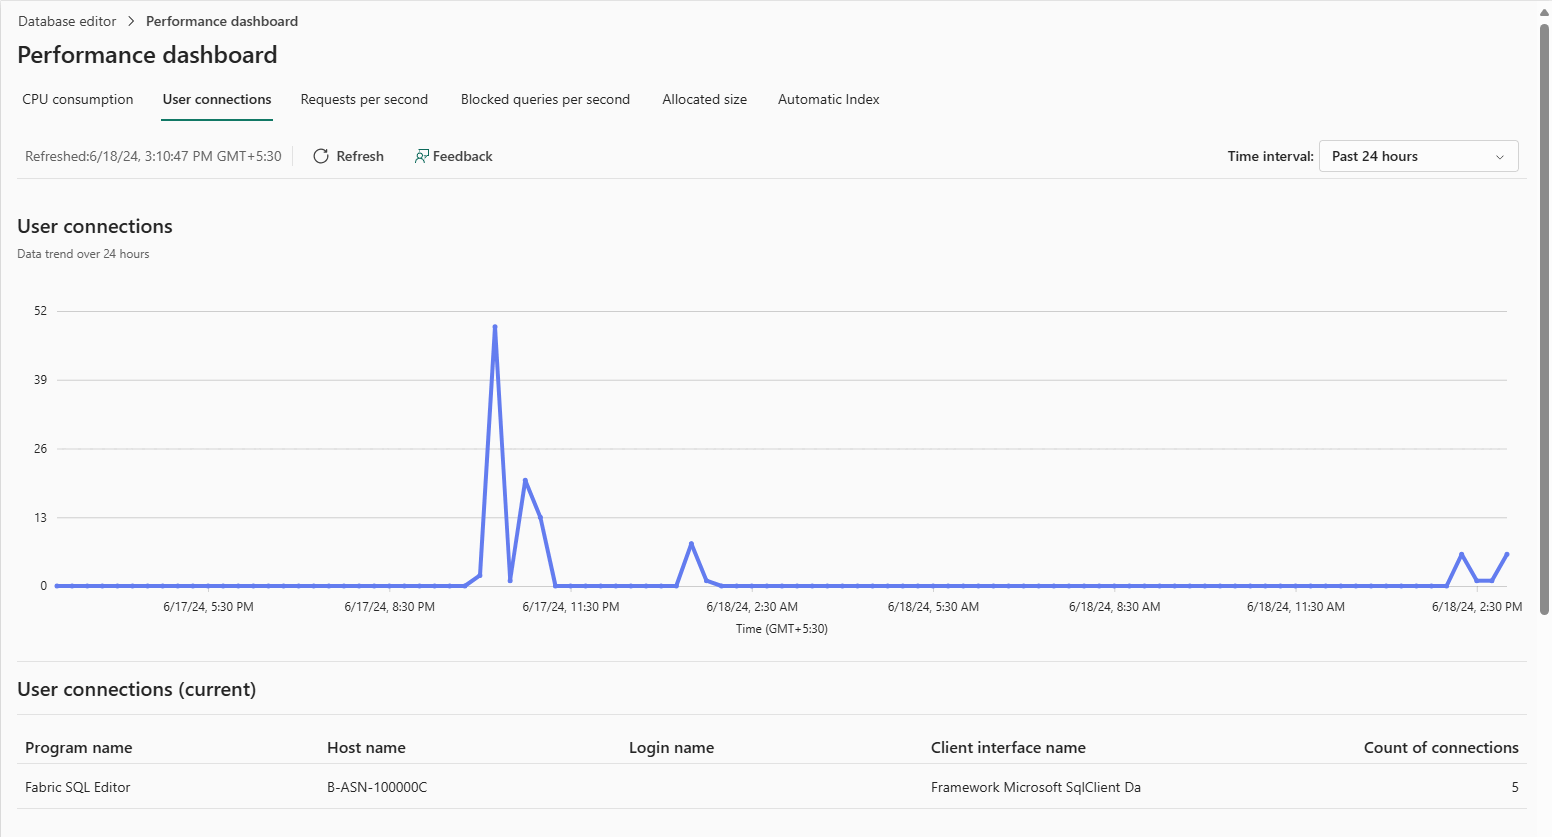
The User connections graph tracks user current connections to the database, with information about each connection. The User connections (current) table lists the current user connections in the table.
Requests per second
The Requests per second graph tracks the cumulative number of times a query has been executed over a period. The Requests per second table contains the most frequently executed queries.
Blocked queries per second
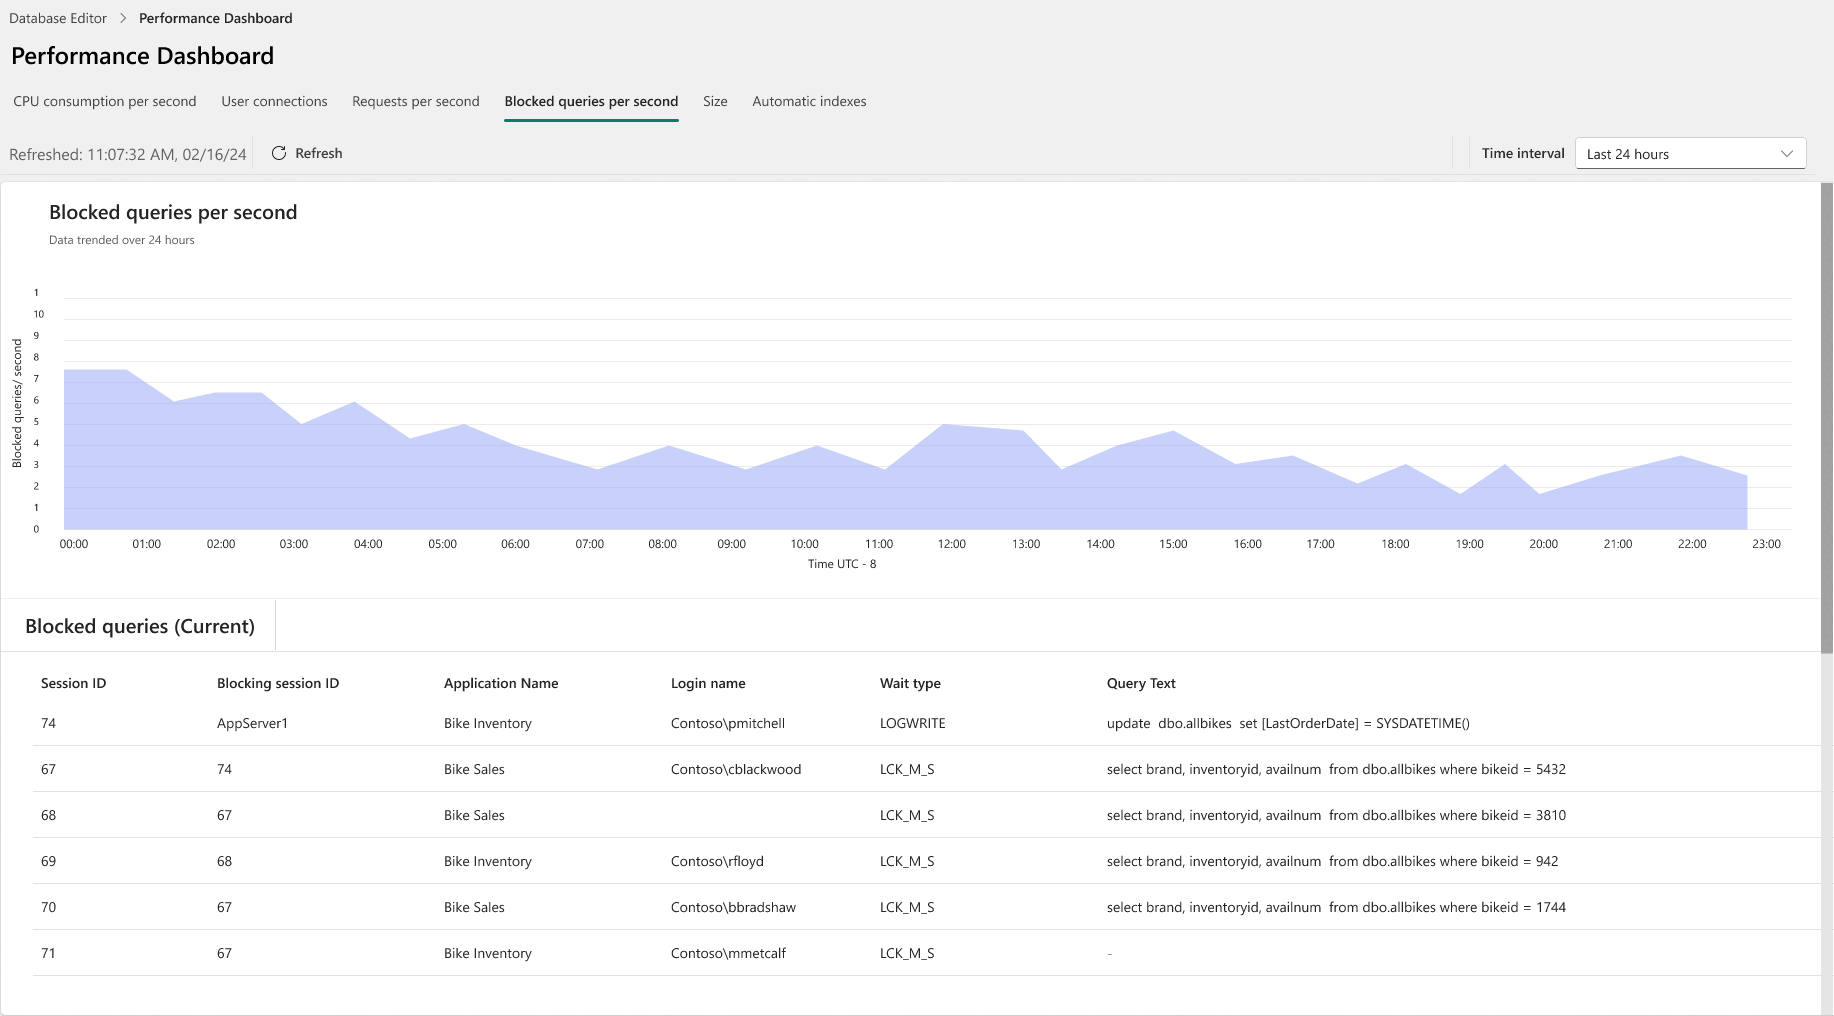
The Blocked queries per second graph tracks queries experience blocks due to locking. The Blocked queries (current) table shows the set of blocked queries at any given point in time.
In the SQL Database Engine, blocking occurs when one session holds a lock on a specific resource and a second SPID attempts to acquire a conflicting lock type on the same resource. Typically, the time frame for which the first SPID locks the resource is small. When the owning session releases the lock, the second connection is then free to acquire its own lock on the resource and continue processing. Blocking is normal behavior and might happen many times throughout the course of a day with no noticeable effect on system performance.
For a detailed look at blocking, see Understand and resolve blocking problems.
Blocked queries due to locking is distinct from deadlocks. While troubleshooting blocking situations, it's important for users to have an idea of the queries that are blocking and how long are they blocking.
Allocated size
The Allocated size tab provides a history of the size of the database. The Largest Database tables (current) table identifies of the tables which have the greatest number of records and consume the maximum space.
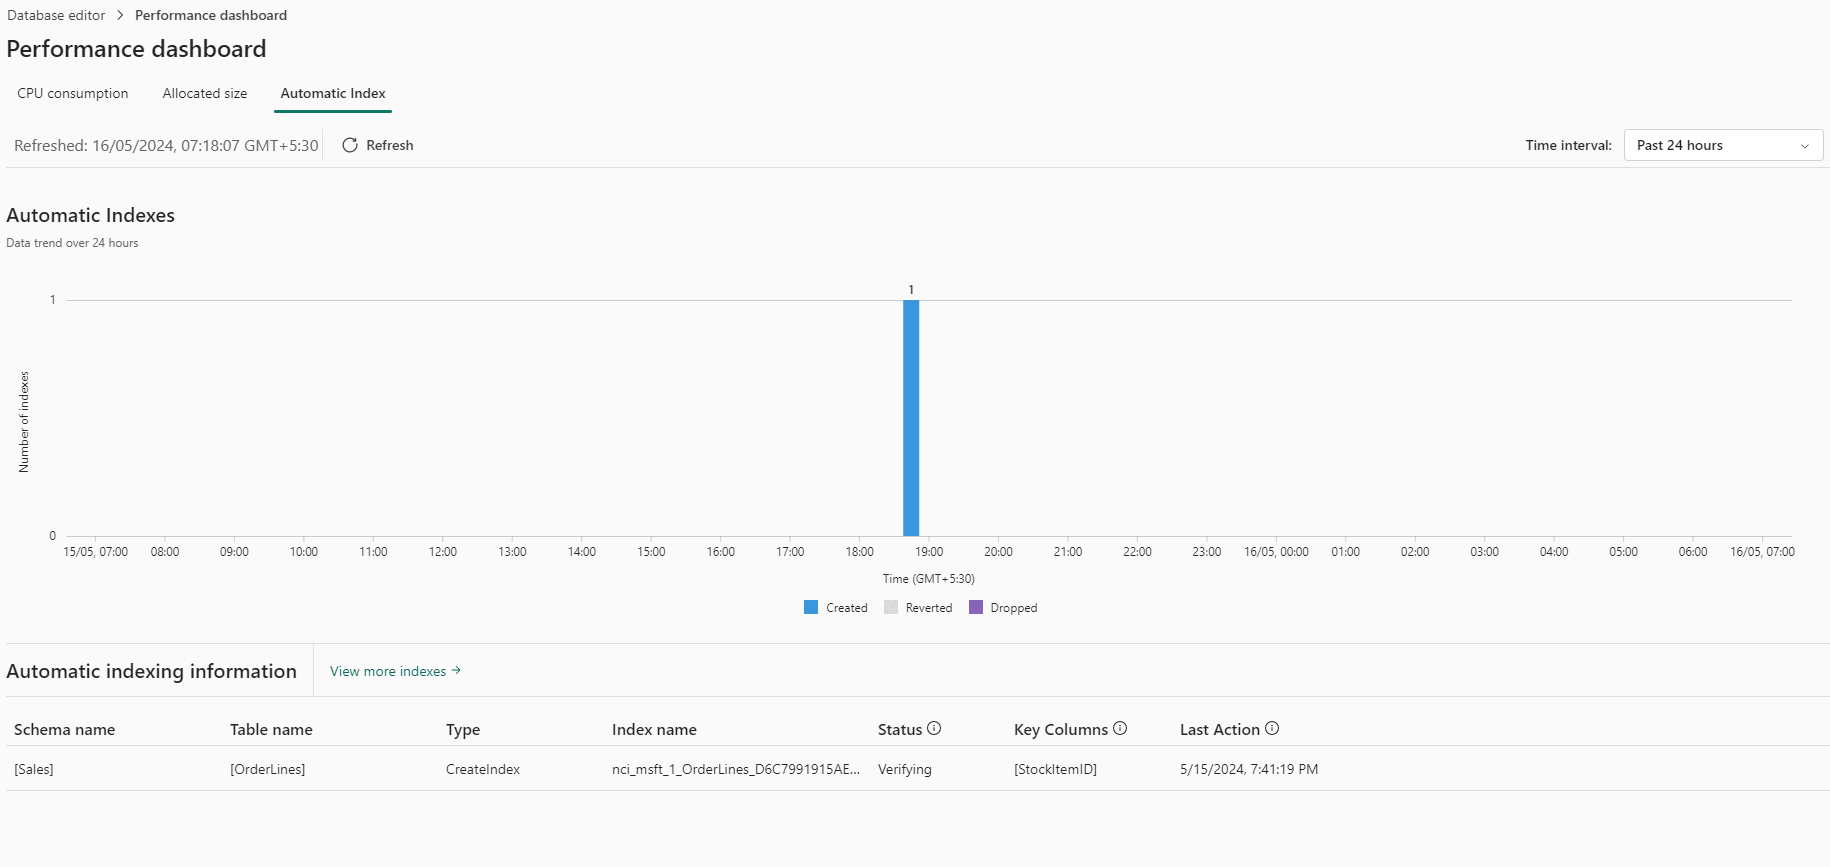
Automatic index
Automatic indexing in databases automates index management, enhancing query performance and data retrieval speed. It adapts by identifying and testing potential indexes based on column usage. The feature improves overall database performance and optimizes resources by removing unused indexes.
The Automatic index tab report shows a history and status of automatically created indexes.
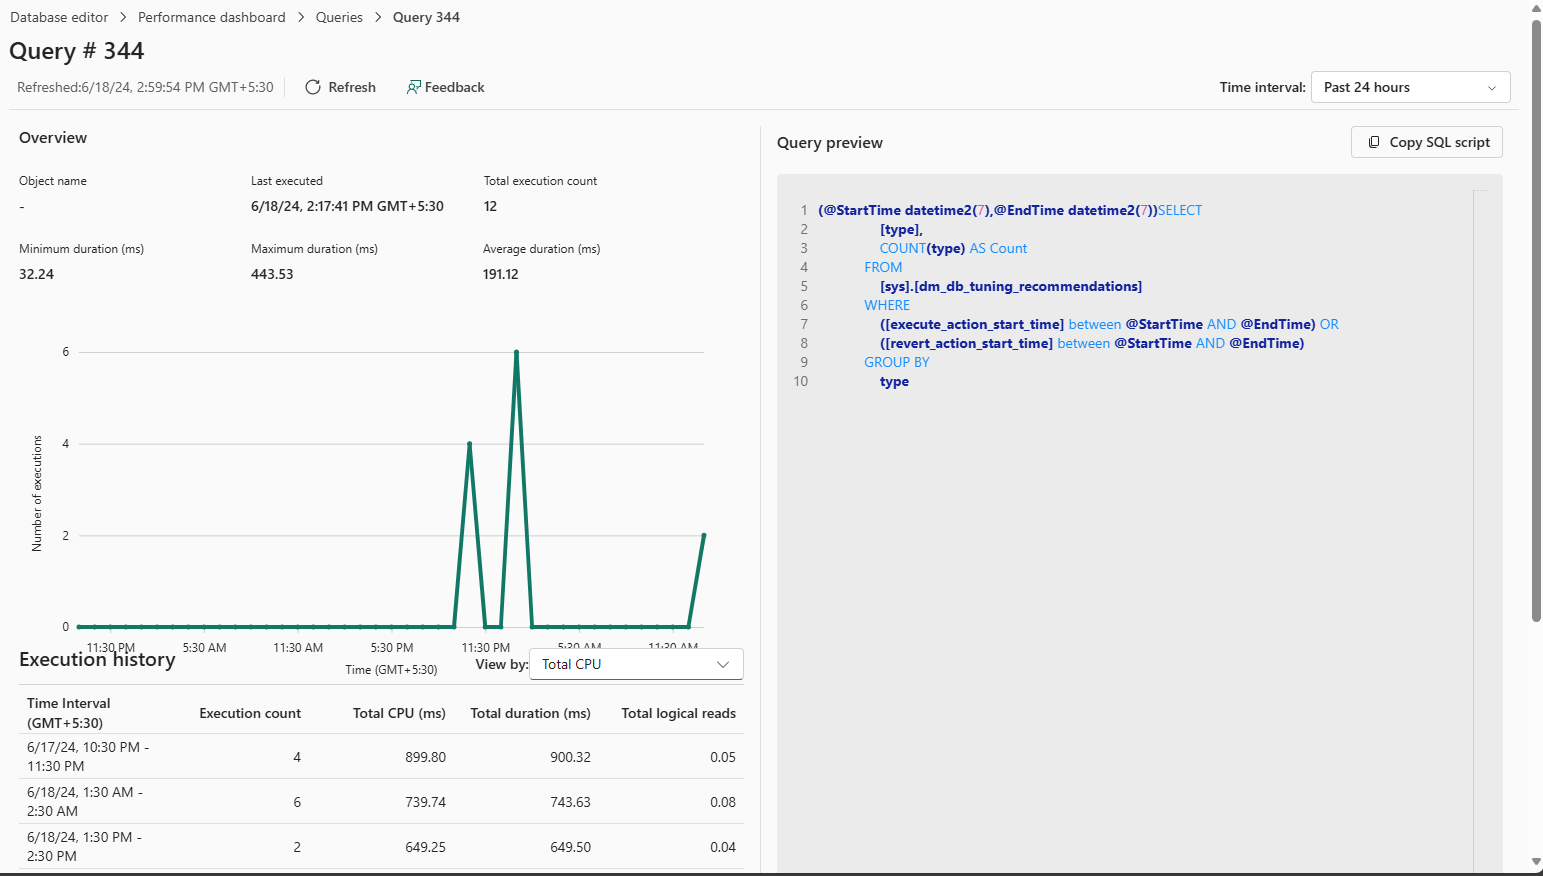
Queries
In the Queries tab, queries can be opened to troubleshoot the query details. Each query includes details including an execution history and query preview.
To troubleshoot a T-SQL query, open the T-SQL code in the query editor, SQL Server Management Studio, the mssql extension with Visual Studio Code. You might also consider the Copilot Explain and Fix quick action features for SQL database in Fabric.
Along with the Query ID and the Query text, metric, and execution count, tabs in the Queries section also provide detailed reports on individual queries by the following metrics:
High CPU usage queries
- A sortable list of queries with the highest CPU consumption, initially sorted by Total CPU (ms) descending.
Longest running queries
- Initially sorted by Total duration (ms) descending.
Most frequent queries
- Initially sorted by Execution count descending.
High read queries
- Initially sorted by Total logical reads descending.

