Inspect requests and responses using Chrome DevTools
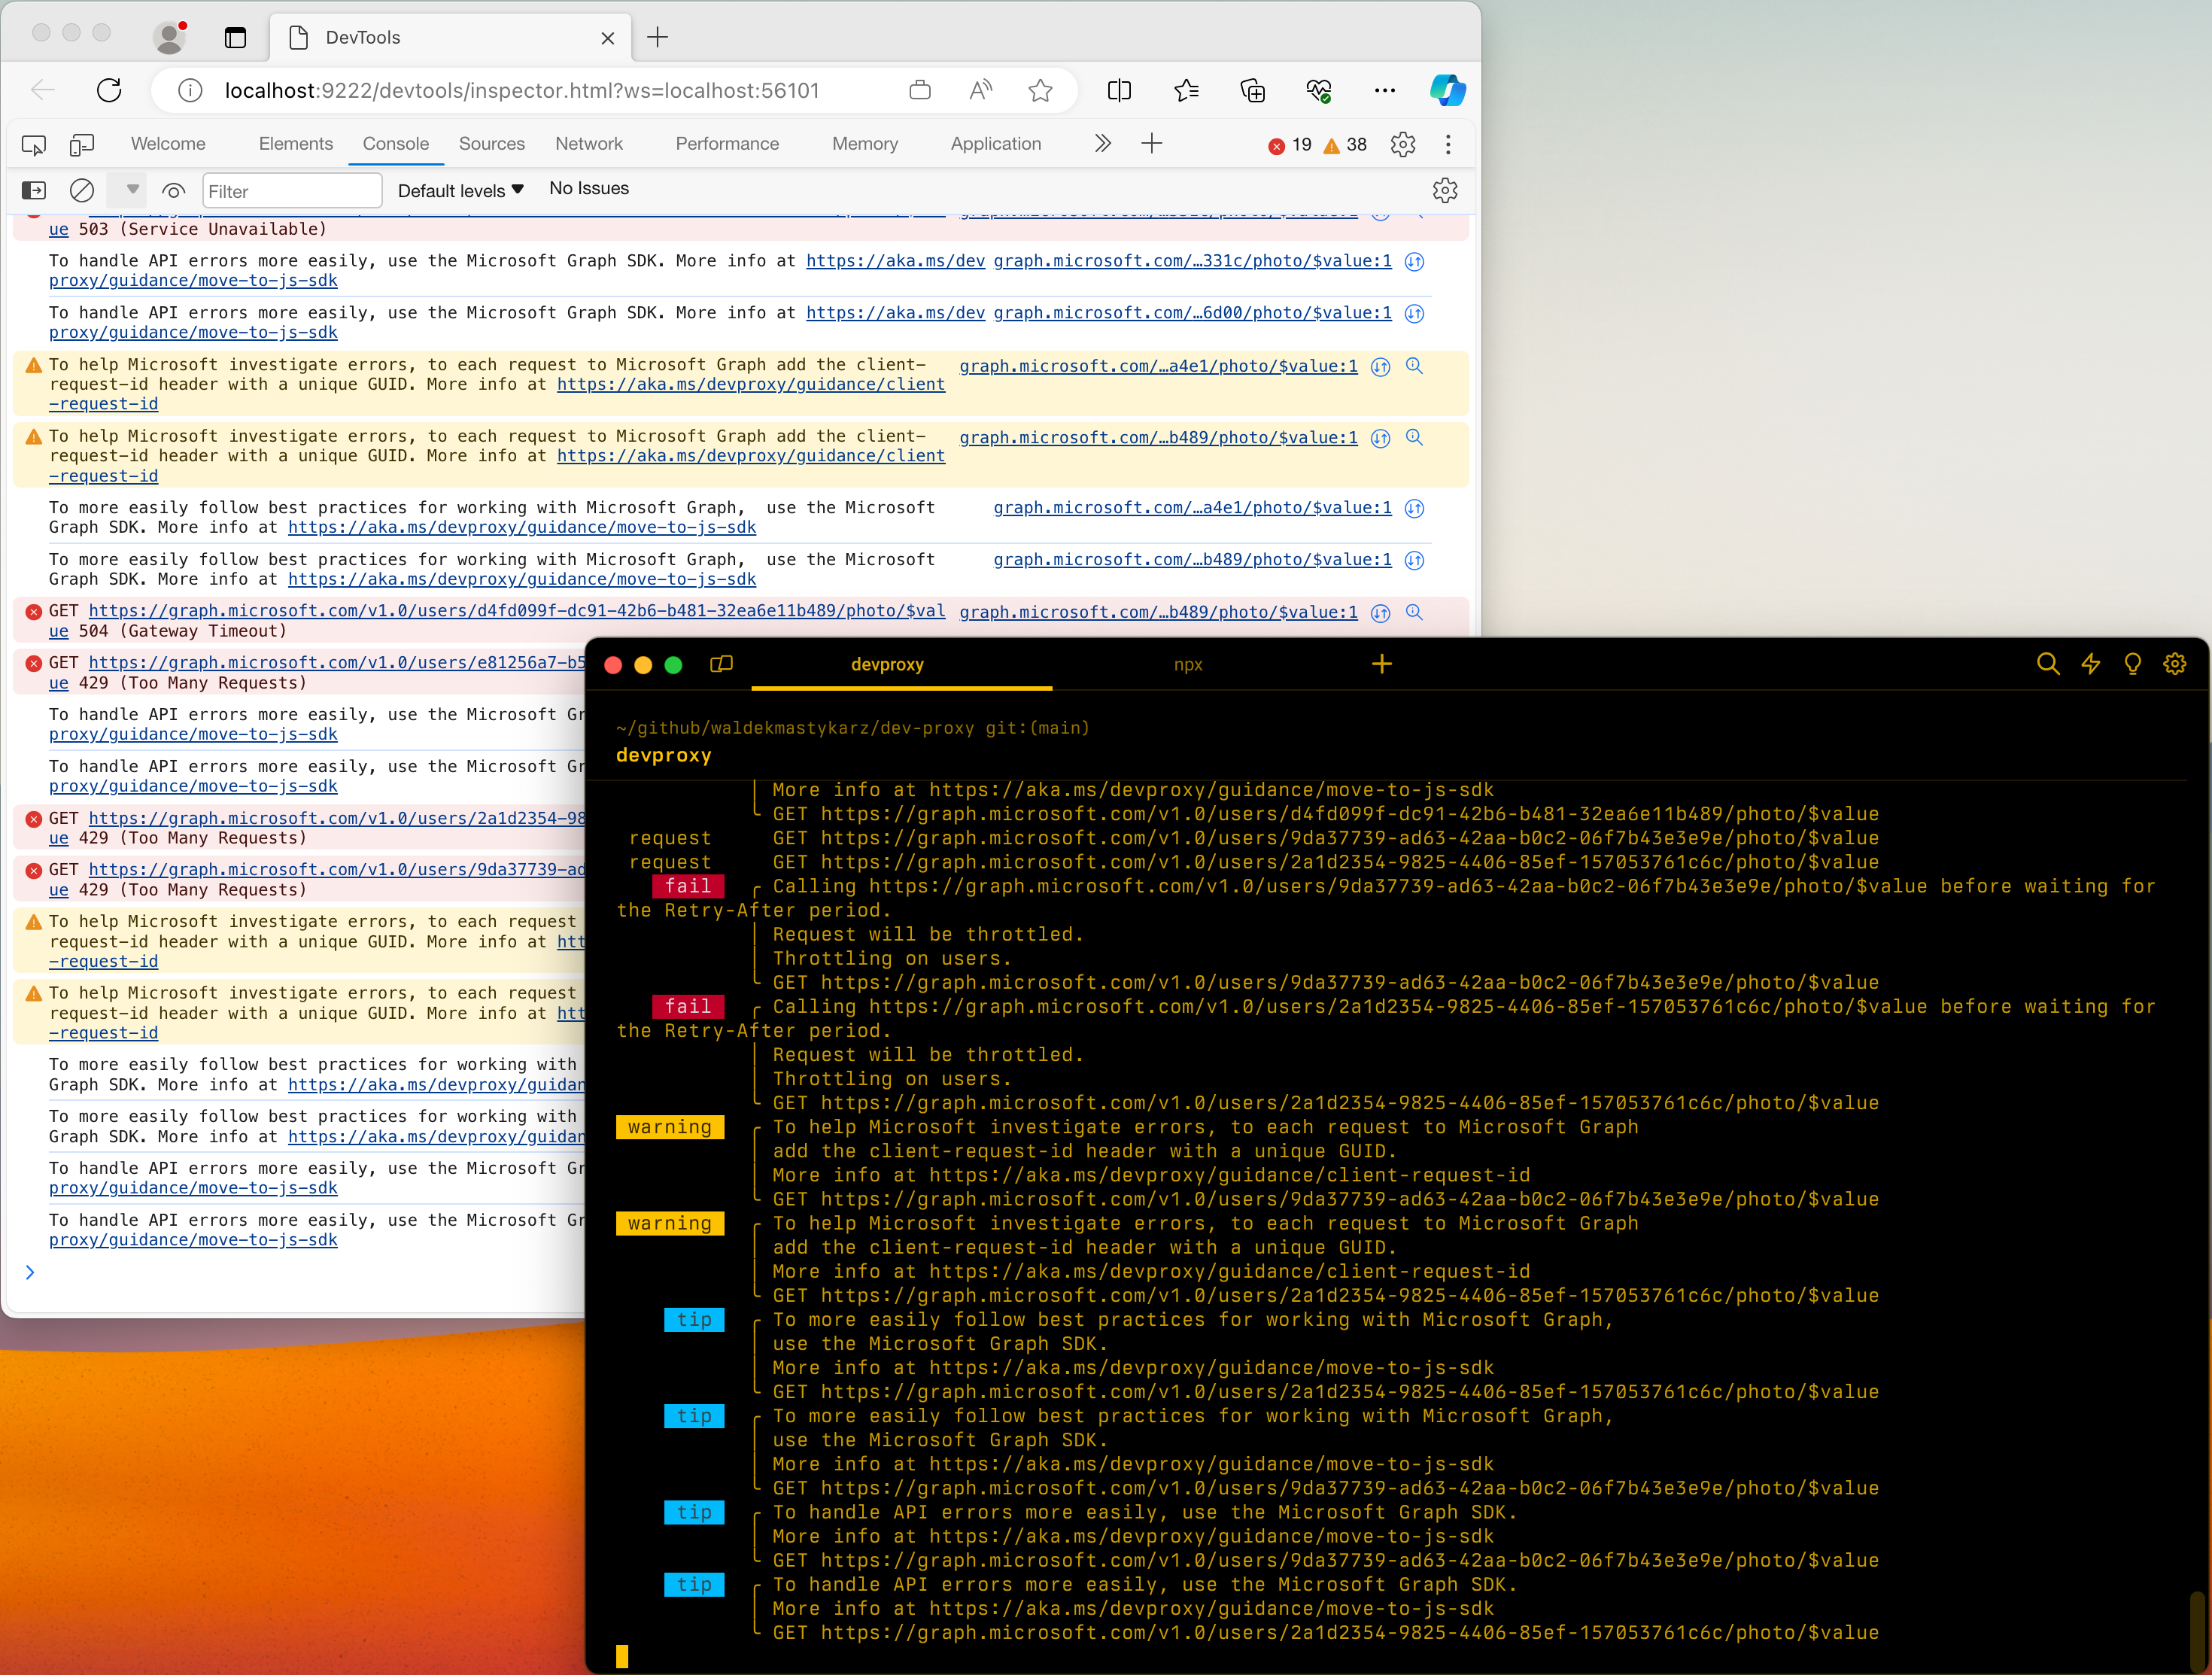
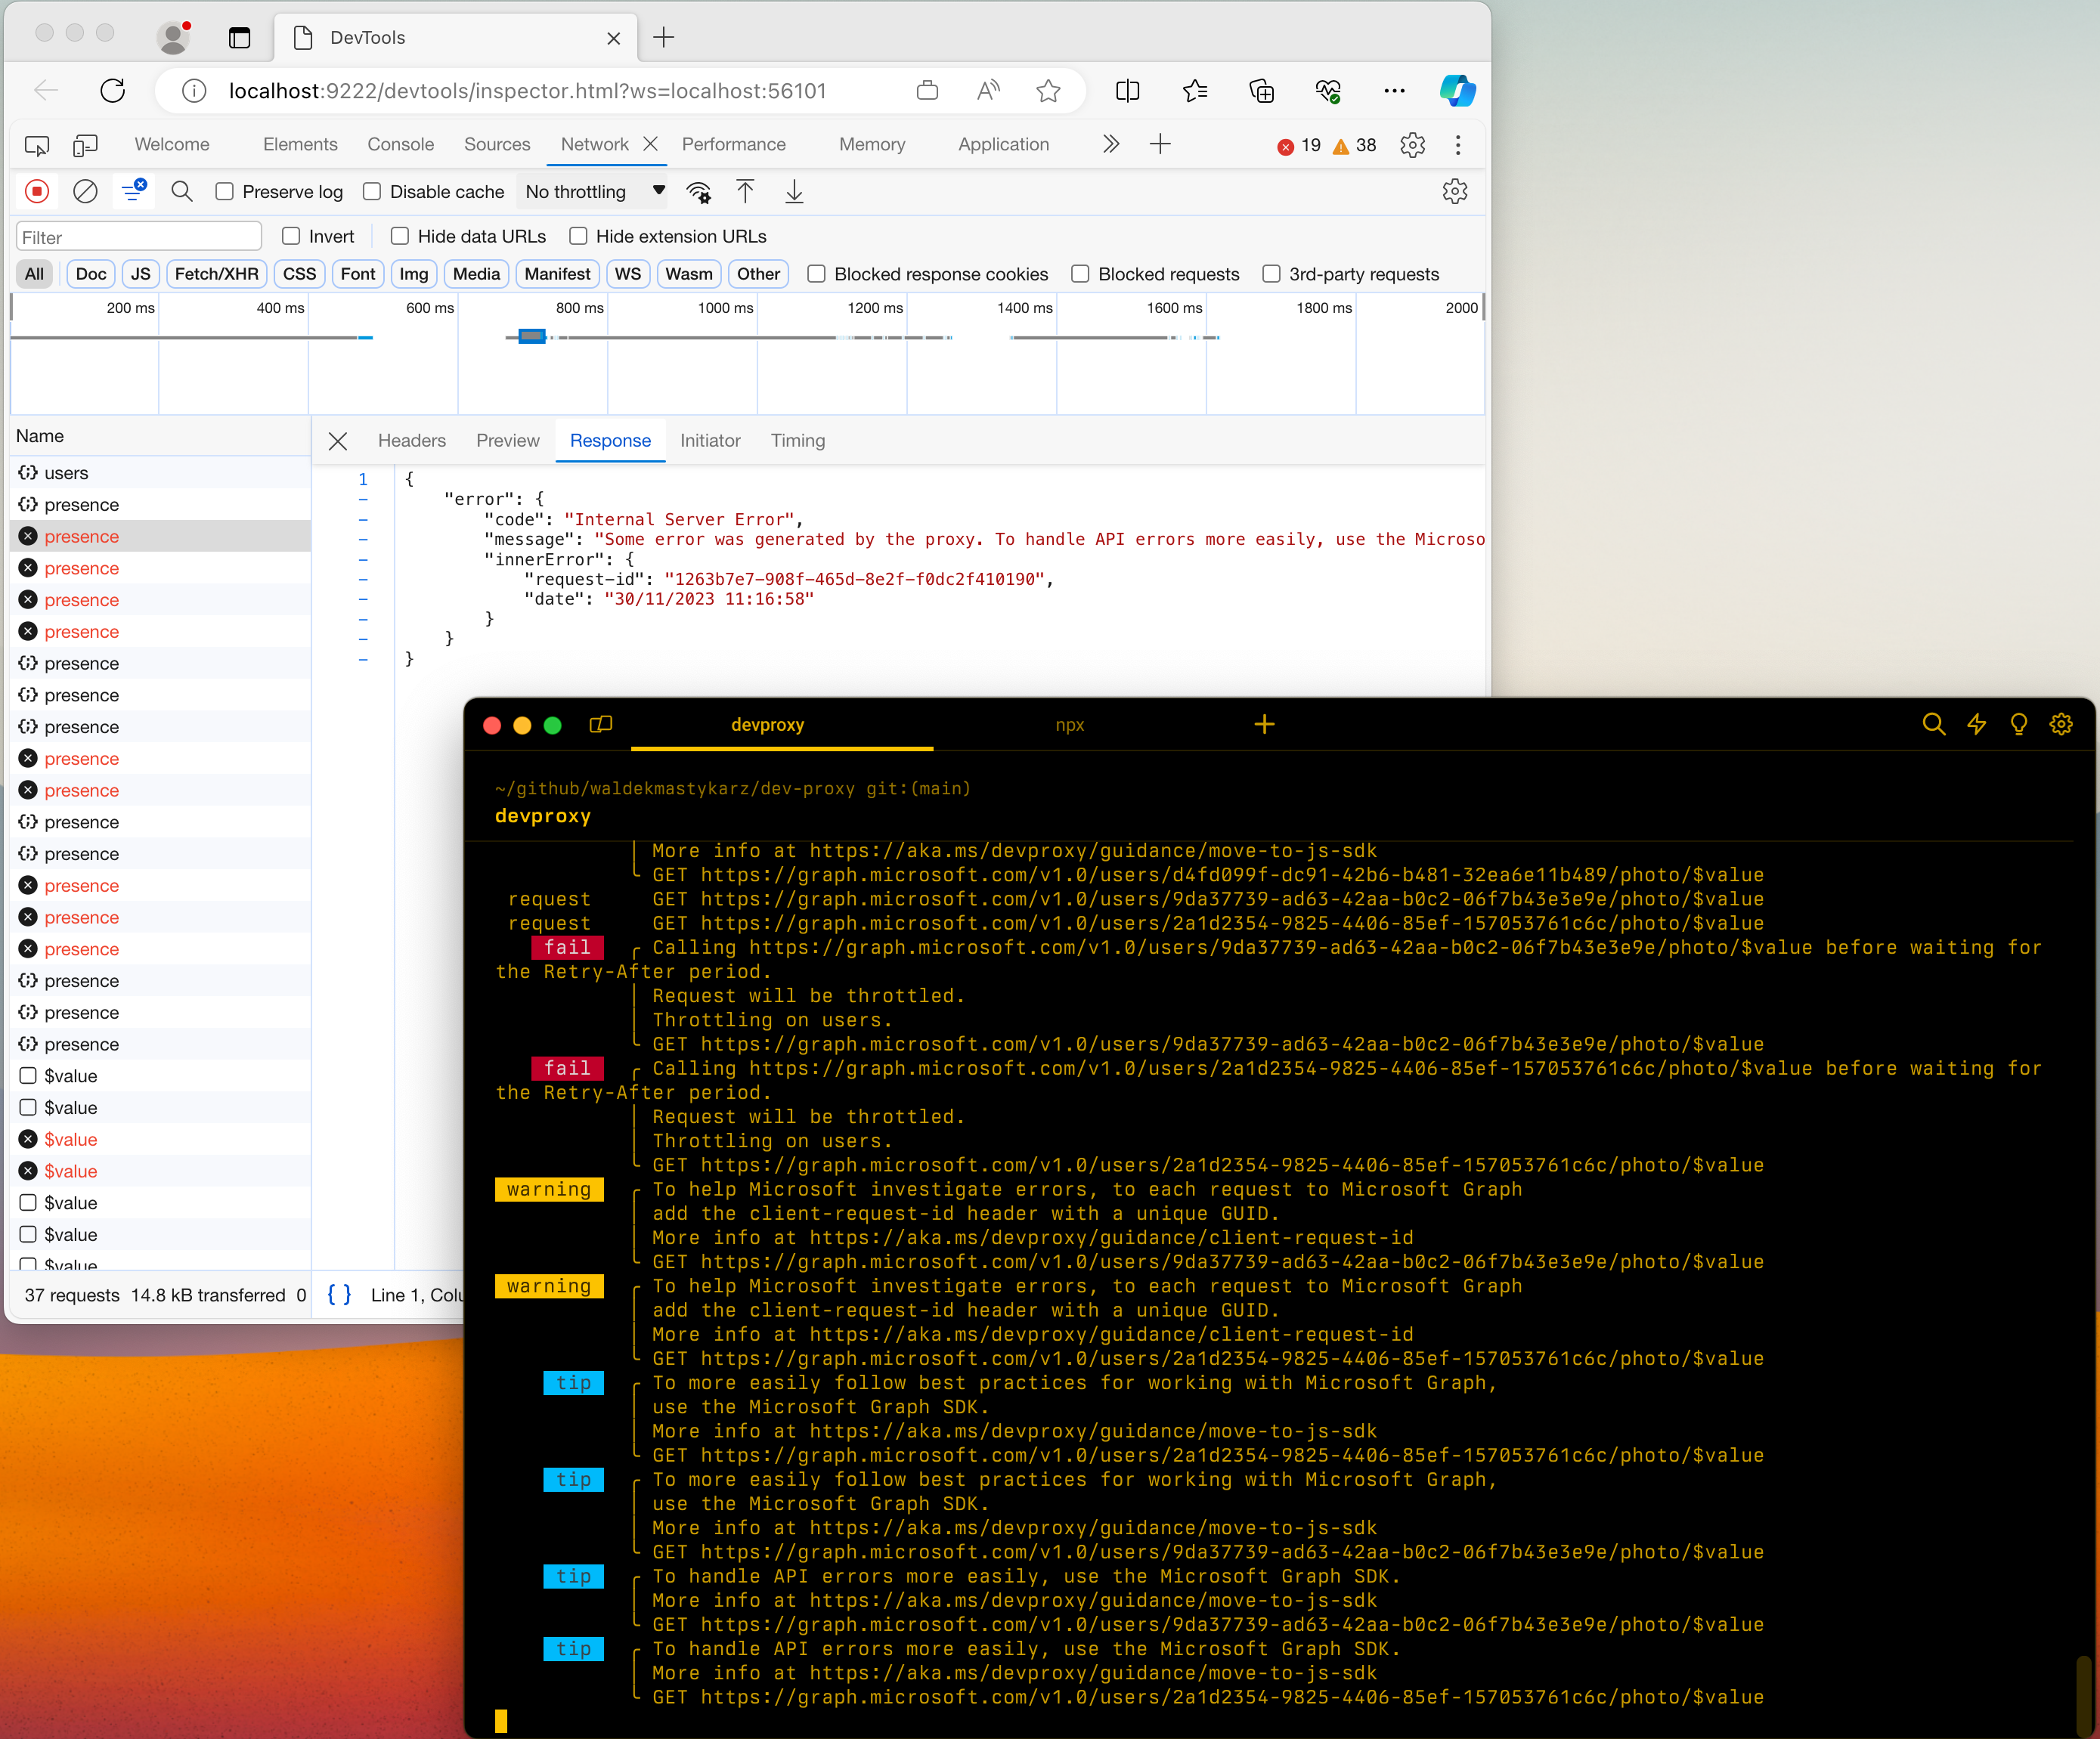
By default, Dev Proxy displays its messages in the command prompt. If you use Dev Proxy with an application that issues many requests, it's difficult to find the messages you're interested in. What's more, you might want to inspect the requests and responses intercepted by Dev Proxy.
To make it easier to find the messages you're interested in, use the DevToolsPlugin plugin to display Dev Proxy messages in Chrome DevTools.
Tip
Dev Proxy supports using Chrome DevTools with Microsoft Edge, Microsoft Edge Dev and Google Chrome.
The DevToolsPlugin exposes Dev Proxy messages, and information about intercepted requests and responses in Chrome DevTools.
To use Chrome DevTools with Dev Proxy:
Open the devproxyrc.json file stored in your Dev Proxy installation directory.
Enable the
DevToolsPluginplugin, by adding the following fragment to thepluginsarray:{ "name": "DevToolsPlugin", "enabled": true, "pluginPath": "~appFolder/plugins/dev-proxy-plugins.dll", "configSection": "devTools" }Add the
devToolssection and specify your preferred browser:"devTools": { "preferredBrowser": "Edge" }Tip
Supported values are:
Edge,EdgeDev,ChromeThe complete
devproxyrc.jsonfile looks like:{ "plugins": [ { "name": "DevToolsPlugin", "enabled": true, "pluginPath": "~appFolder/plugins/dev-proxy-plugins.dll", "configSection": "devTools" } ], "devTools": { "preferredBrowser": "Edge" } }Save the
devproxyrc.jsonfile and start Dev Proxy.

