Get started with datamarts
This article describes how to get started using datamarts, including various sample data that can jump-start your experience. You'll learn about sample semantic models you can use with datamarts, how to create datamarts from scratch, how to rename or delete a datamart, and other helpful information to get you acquainted and proficient with datamarts.
Sample data
You can use the following various types of sample data to explore datamarts. All of the following resources contain free sample data:
Eight Departmental Samples in Excel workbook format, which are Excel versions of the Power BI built-in samples containing the semantic models from numerous use cases:
- Customer profitability
- IT spend analysis
- Human resources
- Opportunity analysis
- Procurement analysis
- Retail analysis
- Sales and marketing supplier quality analysis
A financial data sample workbook, which is a simple flat table in an Excel file available for download. It contains anonymous data with fictitious products including sales divided by segments and region.
An Excel workbook version of the AdventureWorks dimensional model, in a tutorial that walks you through creating a Power BI report with the data.
COVID 19 world data is based on data from Johns Hopkins University. Before publishing this data, we recommend reviewing the disclaimers article.
Northwind Traders OData feed, data from a fictitious organization that manages orders, products, customers, suppliers, and many other aspects of a small business.
You can also start using datamarts from any dataflow you currently have as well. Starting from an existing dataflow will copy data into your datamart, at which point you can apply other transformations or just use it as a data source to explore datamarts.
Create a datamart
To create a datamart, navigate to your existing Power BI Premium or Premium Per User (PPU) workspace. Datamarts require a Power BI Premium subscription. In your Premium workspace, select + New and then select **Datamart (Preview) to create a datamart.
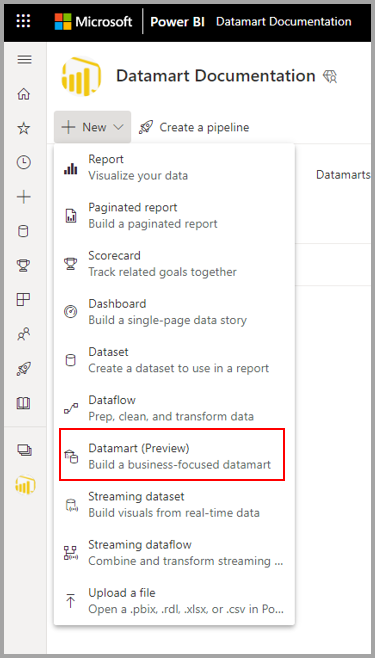
It usually takes approximately 10 seconds to provision a new datamart. Once initialized, you can load data into your datamart. For more information about getting data into a datamart, see the get and transform data section in this article.
Get and transform data
There are many ways to connect to data and transform it in a datamart. For general information about data in Power BI, see connect to data in Power BI.
To load data into your datamart, open your datamart (or create a new datamart) and select Get Data.
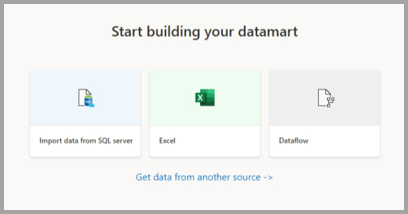
If you choose to get data from another source, a data source selection window appears where you can select from a multitude of data sources.
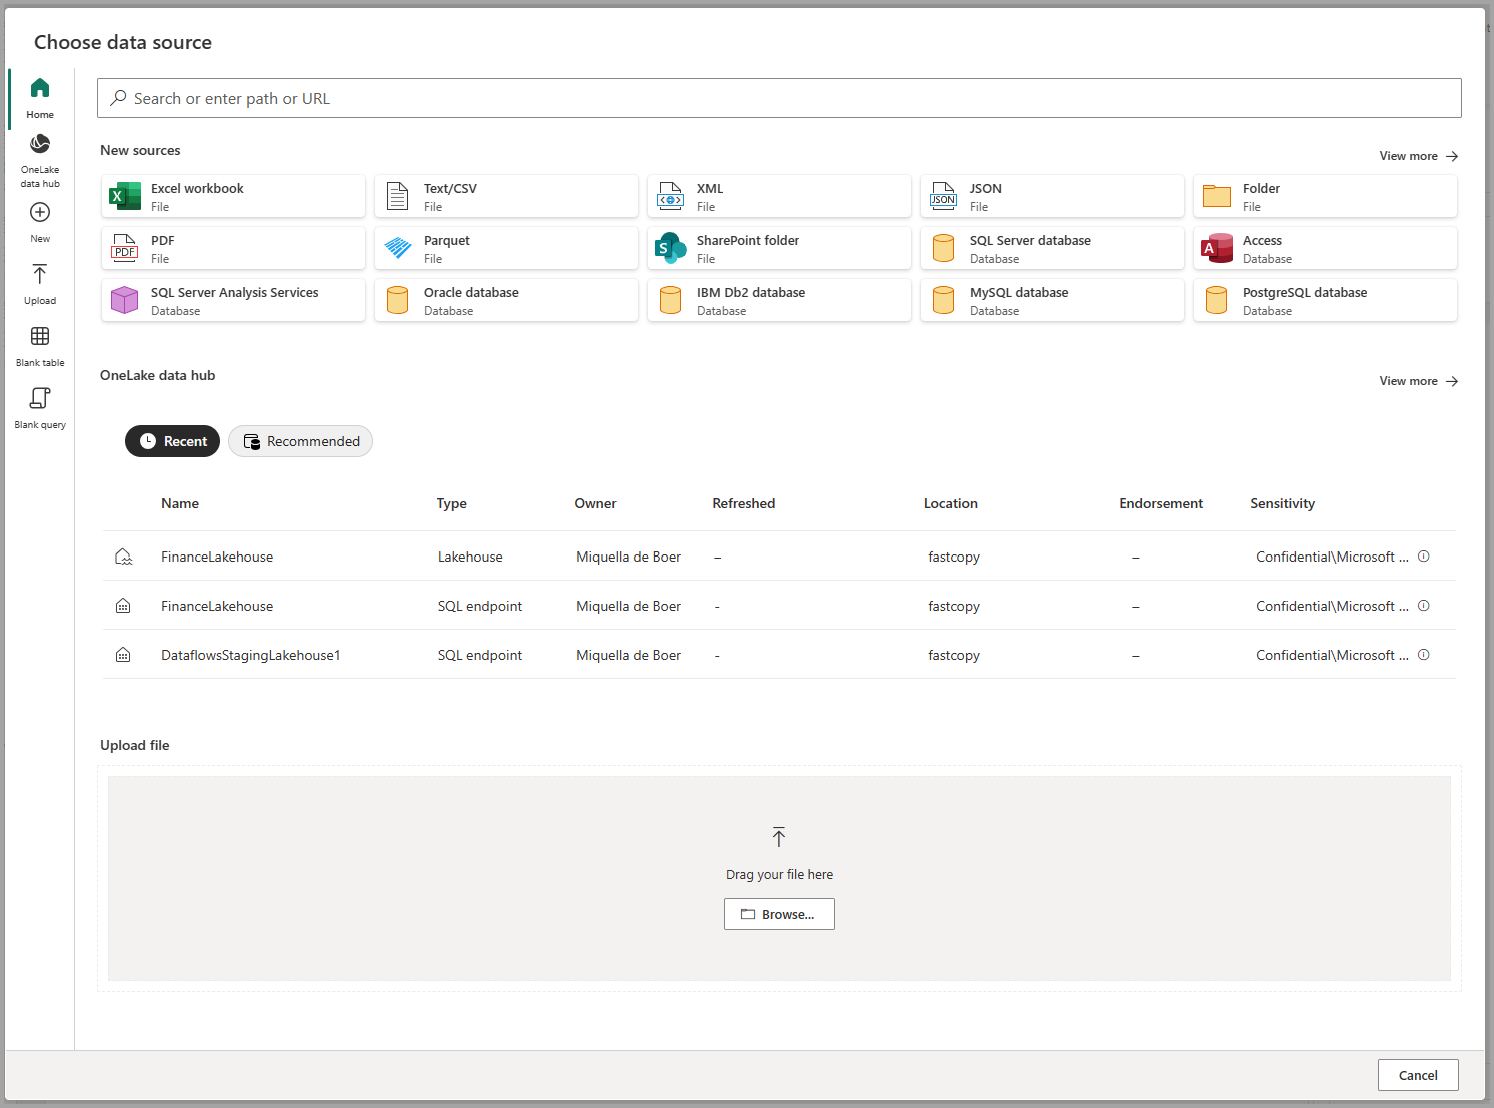
You can also drag and drop files from your computer to load data into your datamart, such as Excel files. Some data sources may require parameters or connection strings to properly connect.
Once connected, select the tables you want to load into your datamart. You can apply transformations to your selected data and load the data into the datamart. Once the data is loaded, the tables are imported into your datamart. You can monitor the progress in the status bar.
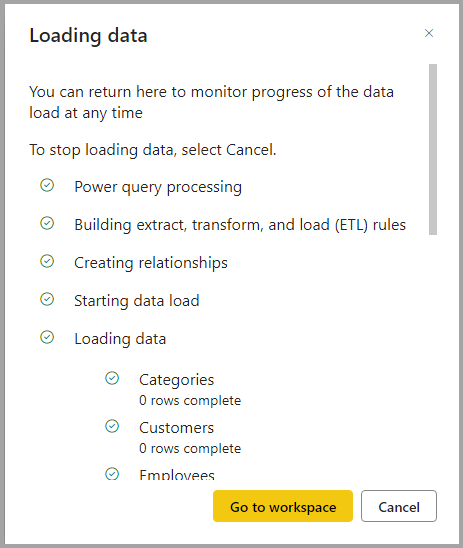
For each table you select, a corresponding view is created in the datamart that appears in the Object explorer in Table View.
Model data
To model your data, navigate to Model view by selecting on the Model View icon at the bottom of the window, as shown in the following image.
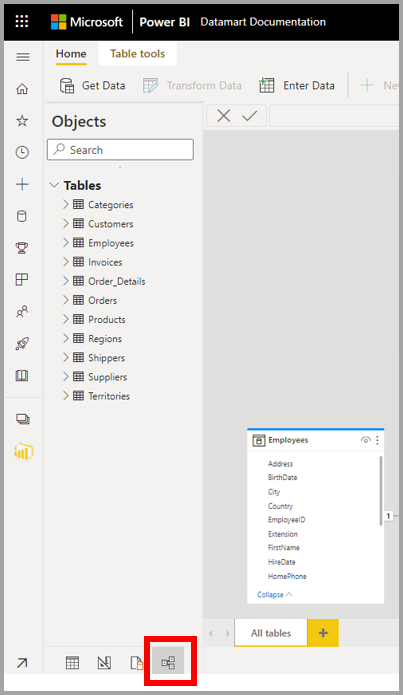
Adding or removing objects to the default semantic model
In Power BI, a semantic model is always required before any reports can be built, so the default semantic model enables quick reporting capabilities on top of the datamart. Within the datamart, a user can add datamart objects - tables to their default semantic model. They can also add additional semantic modeling properties, such as hierarchies and descriptions. These are then used to create the Power BI semantic model’s tables. Users can also remove objects from the default semantic model.
To add objects – tables or views to the default semantic model, a user has 2 options:
- Automatically add objects to the semantic model, which happens by default with no user intervention needed
- Manually add objects to the semantic model
The auto detect experience determines any tables or views and opportunistically adds them.
The manually detect option in the ribbon allows fine grained control of which object(s) – tables and/or views, should be added to the default semantic model:
- Select all
- Filter for tables or views
- Select specific objects
To remove objects, a user can use the manually select button in the ribbon and:
- Un-select all
- Filter for tables or views
- Un-select specific objects
Using model view layouts
During the session, users may create multiple tabs in the model view to further assist with database design. Currently the model view layouts are only persisted in session. Users can use the auto-layout whenever a new tab is created to visually inspect the database design and understand the modeling.
Create a measure
To create a measure (a measure is a collection of standardized metrics) select the table in the Table Explorer and select the New Measure button in the ribbon, as shown in the following image.
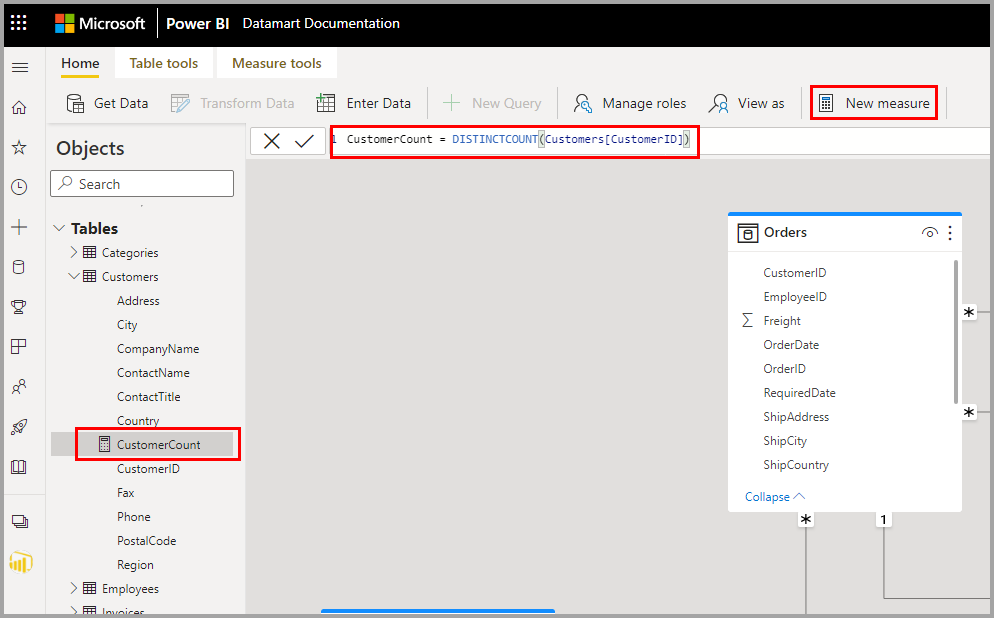
Enter the measure into the formula bar and specify the table and the column to which it applies. The formula bar lets you enter your measure. Similar to Power BI Desktop, the DAX editing experience in datamarts presents a rich editor complete with auto-complete for formulas (intellisense). The DAX editor enables you to easily develop measures right in datamart, making it a more effective single source for business logic, semantics, and business critical calculations.
You can expand the table to find the measure in the table.
Create a relationship
To create a relationship in a datamart, select the Model view and select your datamart, then drag the column from one table to the column on the other table to initiate the relationship. In the window that appears, configure the relationship properties.
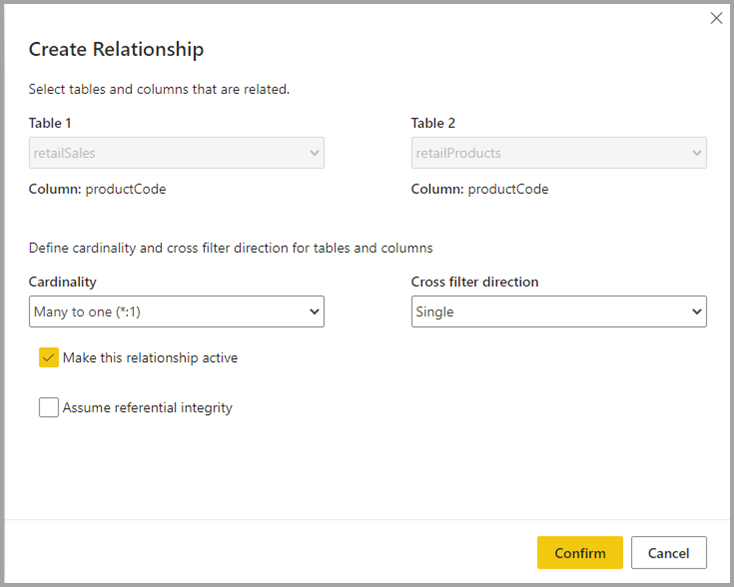
Select the Confirm button when your relationship is complete to save the relationship information.
Hide elements from downstream reporting
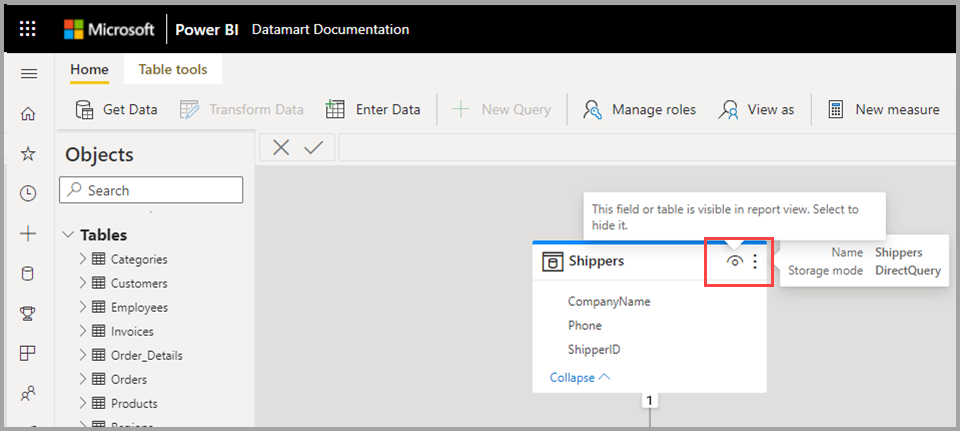
You can hide elements of your datamart from downstream reporting by selecting Table view and right-clicking on the column or table you want to hide. Then select Hide in report view from the menu that appears to hide the item from downstream reporting.
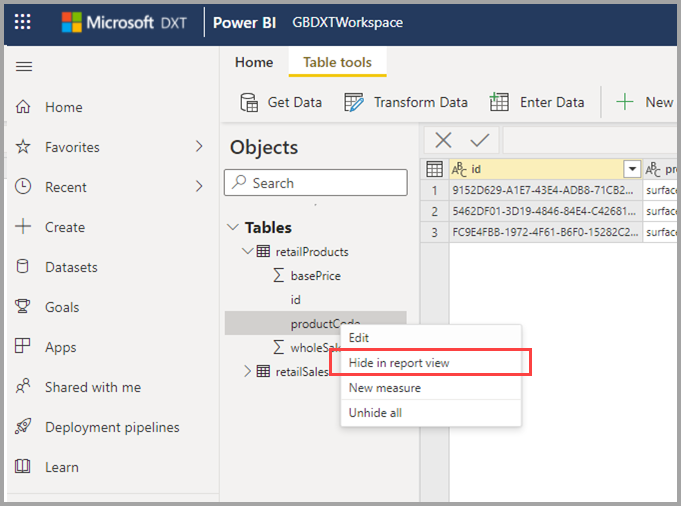
You can also hide the entire table and individual columns by using the Model view canvas options, as shown in the following image.
Access auto-generated semantic models
To access auto-generated semantic models, go to the Premium workspace and find the semantic model that matches the name of the datamart.
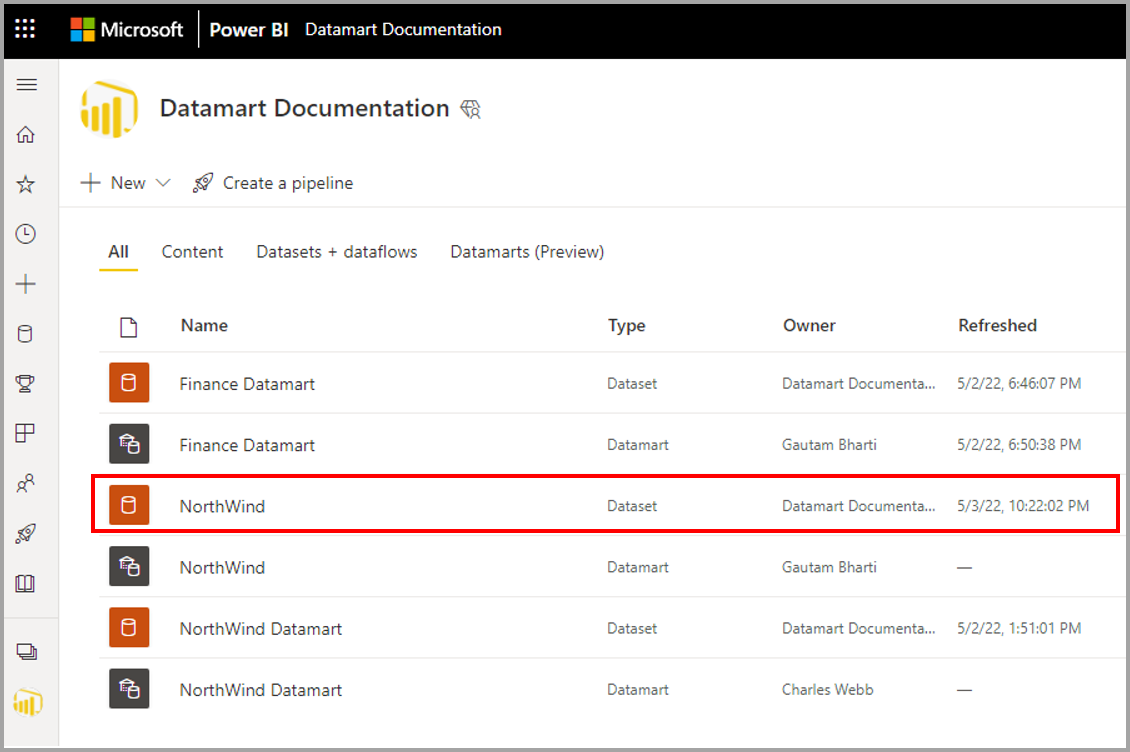
To load the semantic model, click the name of the semantic model.
Manage datamart refresh
You can refresh a datamart in two ways:
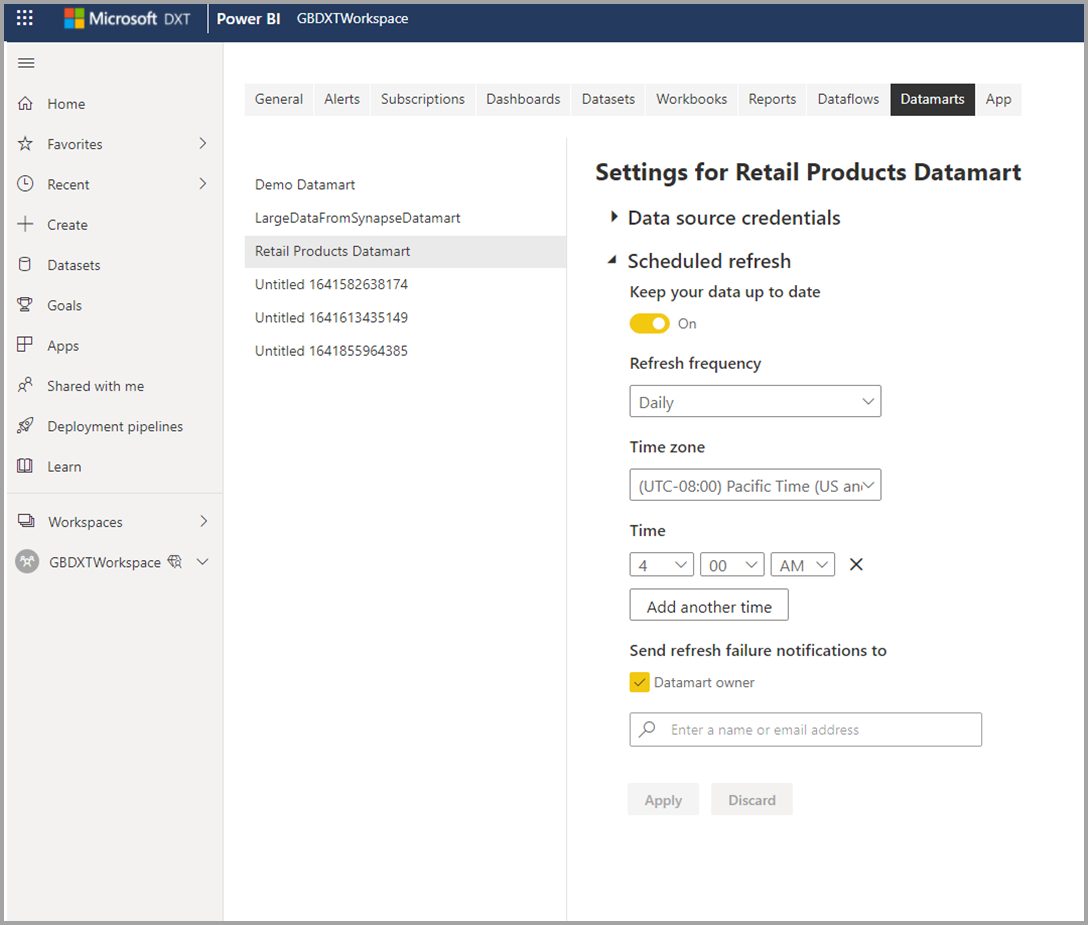
From the datamart context menu, select Refresh now or select Scheduled refresh.

From the datamart settings page, select Scheduled refresh
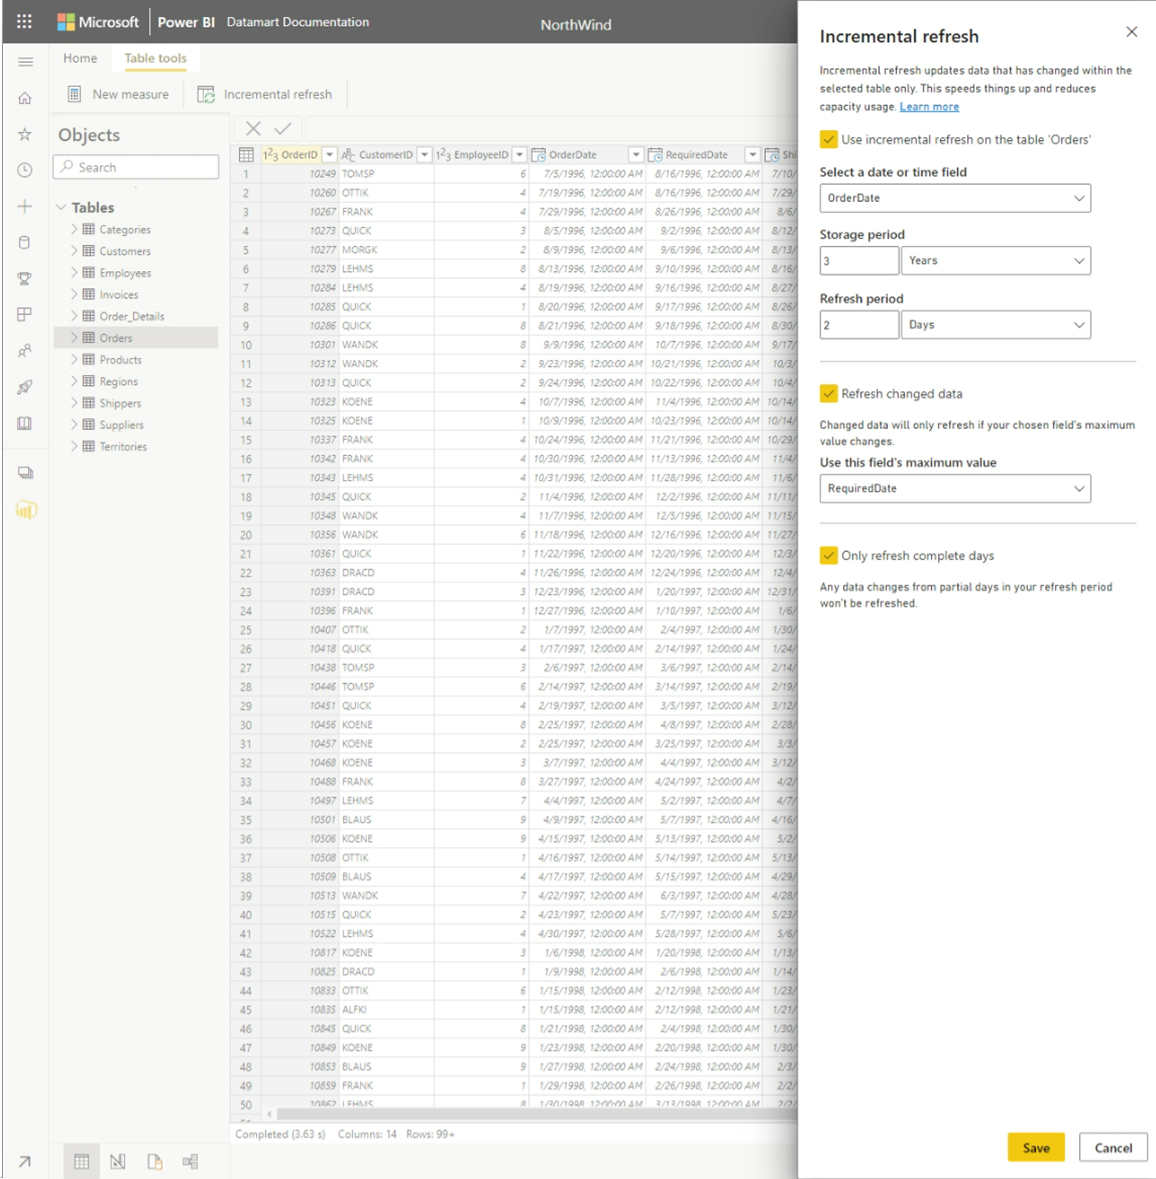
To set up incremental refresh for a datamart, select the table for which you want to set up incremental refresh for in the datamart editor. In the Table tools ribbon, select the Incremental refresh icon, and a right pane appears enabling you to configure incremental refresh for the selected table.
Datamarts and deployment pipelines
Datamarts are supported in deployment pipelines. Using deployment pipelines, you can deploy updates to your datamart across a designated pipeline. You can also use rules to connect to relevant data in each stage of the pipeline. To learn how to use deployment pipelines, see Get started with deployment pipelines.
Access or load an existing datamart
To access an existing datamart, navigate to your Power BI Premium workspace and find your datamart from the overall list of data items in your workspace, as shown in the following image.
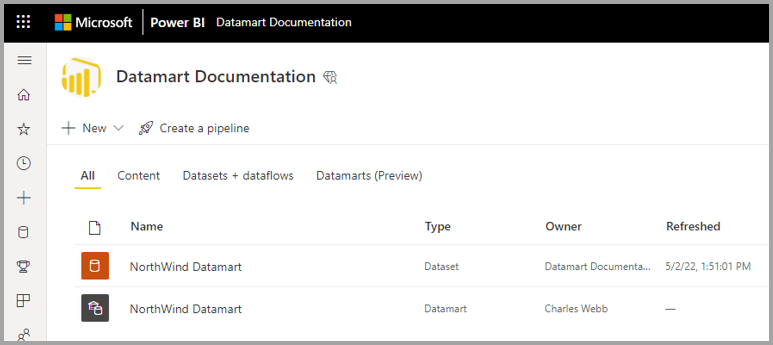
You can also select the Datamarts (Preview) tab in your Premium workspace, and see a list of available datamarts.
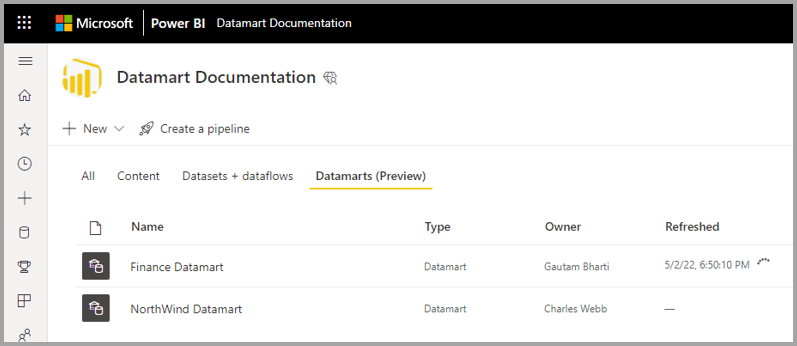
Select the datamart name to load the datamart.
Rename a datamart
There are two ways to rename a datamart:
First, from within the Datamart editor, select the datamart name from the top of the editor and edit the datamart name in the window that appears, as shown in the following image. Select on the ribbon outside of the rename window to save the new name.
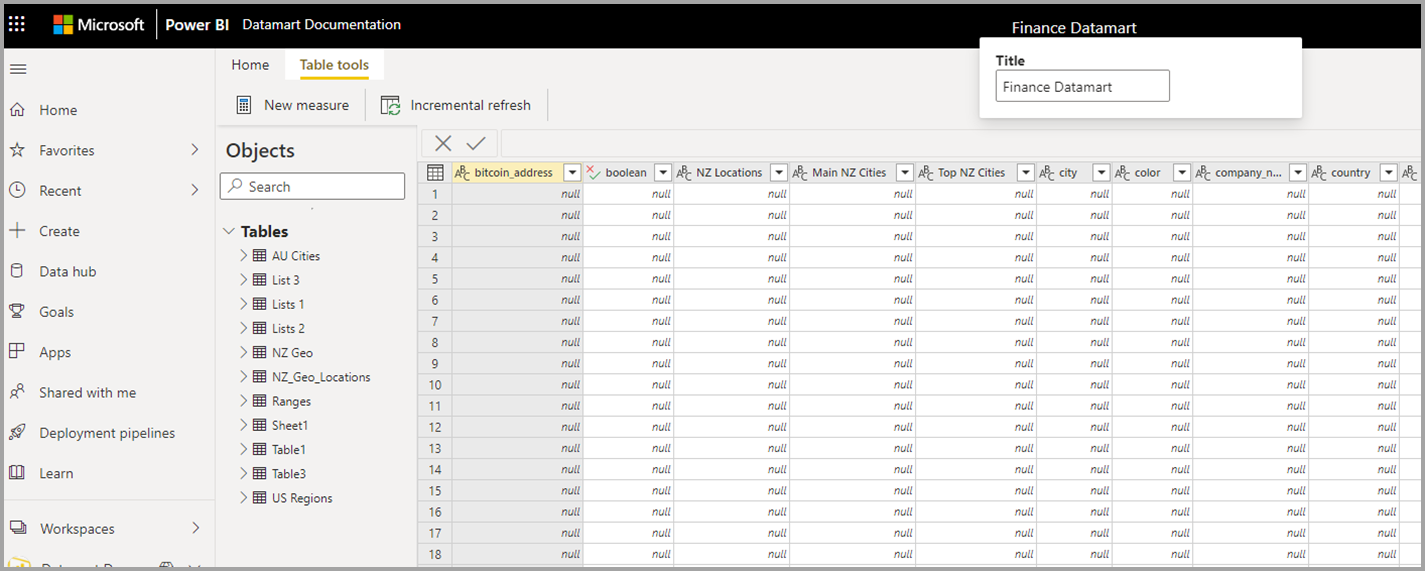
Alternatively, you can change the datamart name from the workspace list view. Select the more menu (...) next to the datamart name in the workspace view.
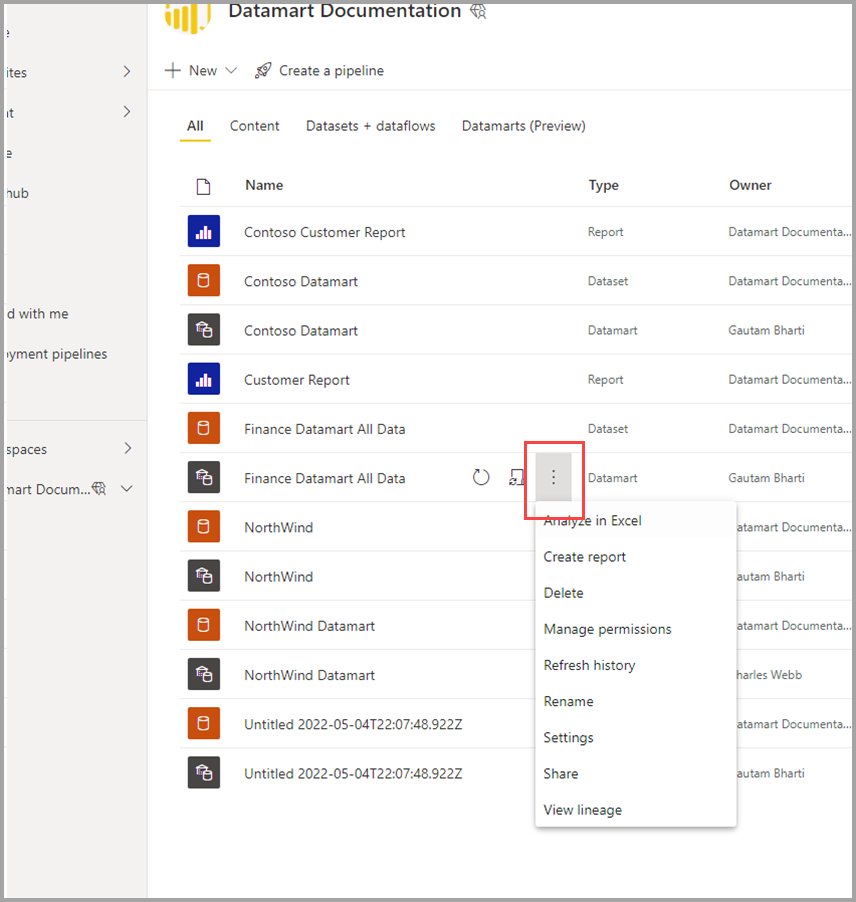
From the menu that appears, select Rename.
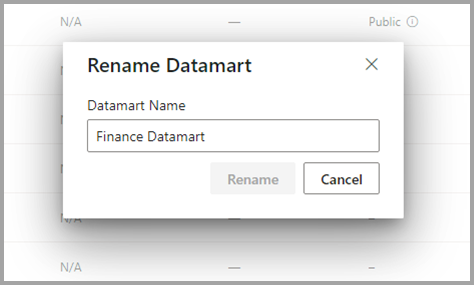
When you rename a datamart, the auto-generated semantic model based on that datamart is also automatically renamed.
Delete a datamart
To delete a datamart, navigate to the workspace and find the datamart you want to delete. Select the more menu (...) and select Delete from the menu that appears.
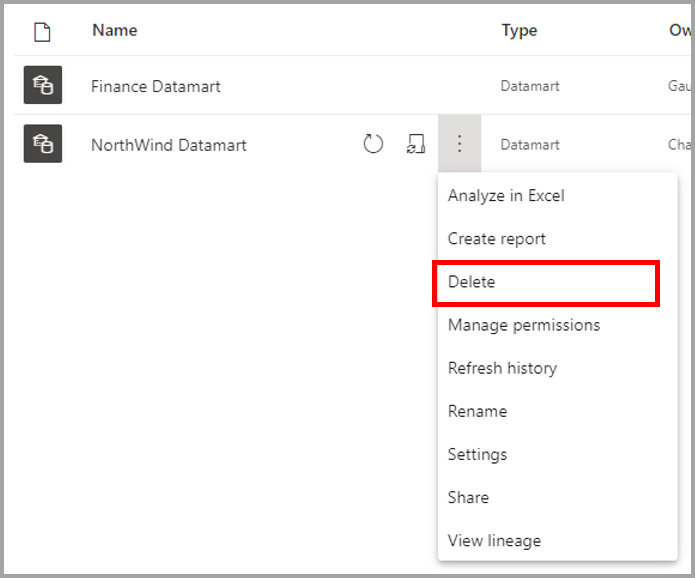
Datamart deletion is not immediate, and requires a few days to complete.
Datamart context menus
Datamarts offer a familiar experience to create reports and access supported actions using its context menus.
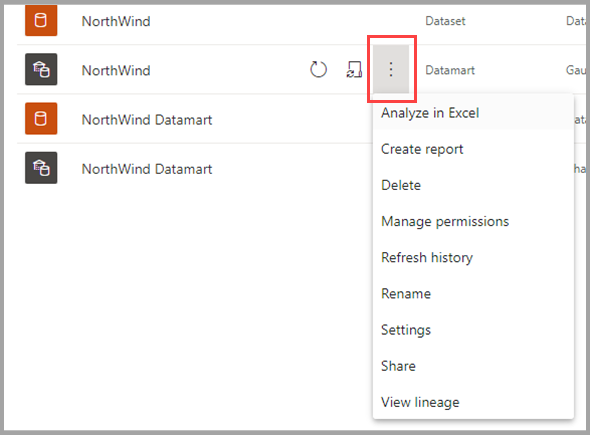
The following table describes the datamart context menu options:
| Menu Option | Option Description |
|---|---|
| Analyze in Excel | Uses the existing Analyze in Excel capability on auto-generated semantic model. Learn more about Analyze in Excel |
| Create report | Build a Power BI report in DirectQuery mode. Learn more about get started creating in the Power BI service |
| Delete | Delete semantic model from workspace. A confirmation dialog notifies you of the impact of delete action. If Delete action is confirmed, then the datamart and related downstream items will be deleted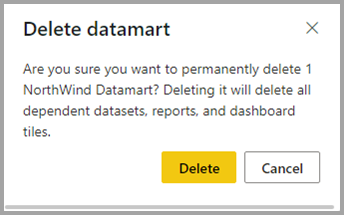
|
| Manage permissions | Enables users to add other recipients with specified permissions, similar to allowing the sharing of an underlying semantic model or allowing to build content with the data associated with the underlying semantic model.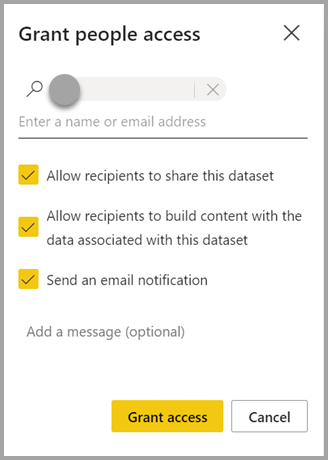
|
| Refresh history | Provides the history of refresh activity with the duration of activity and status.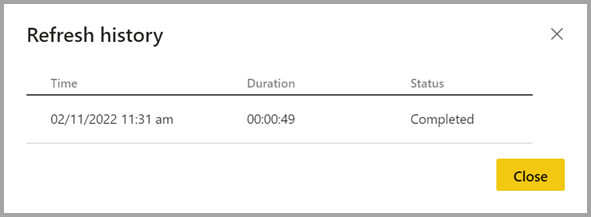
|
| Rename | Updates the datamart and auto-generated semantic model with the new name.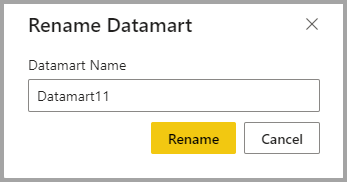
|
| Settings | Learn more about datamart settings |
| Share | Lets users share the datamart to build content based on the underlying auto-generated semantic model and query the corresponding SQL endpoint. Shares the datamart access (SQL- read only, and autogenerated semantic model) with other users in your organization. Users receive an email with links to access the detail page where they can find the SQL Server URL and can access the auto-generated semantic model to create reports based on it.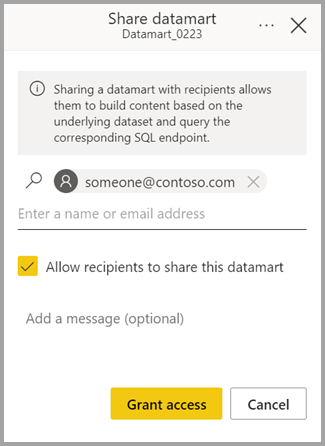
|
| View lineage | This shows the end-to-end lineage of datamarts from the data sources to the datamart, the auto-generated semantic model, and other semantic models (if any) that were built on top of the datamarts, all the way to deports, dashboards and apps.
|
Datamart settings
Datamart settings are accessible from the context menu for datamarts. This section describes and explains the datamart settings options and their description. The following image shows the datamart settings menu.
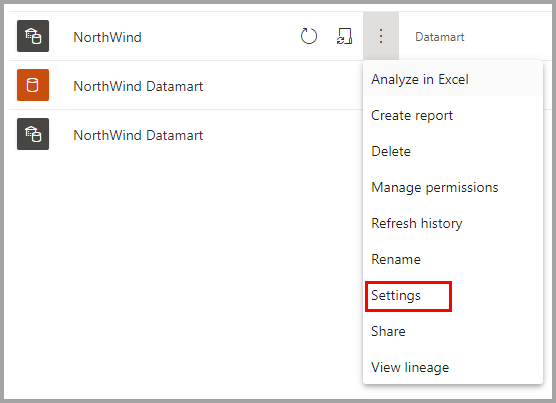
The following is a list of settings available for each datamart.
| Setting | Detail |
|---|---|
| Datamart description | Lets users add metadata details to provide descriptive information about a datamart.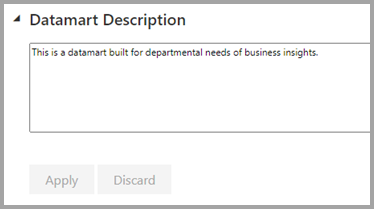
|
| Server settings | The SQL endpoint connection string for a datamart. You can use the connection string to create a connection to the datamart using various tools, such as SSMS.
|
| Data source credentials | Lets you get data source information and edit credentials.
|
| Schedule refresh | Data refresh information for the datamart, based on the schedule defined by the user.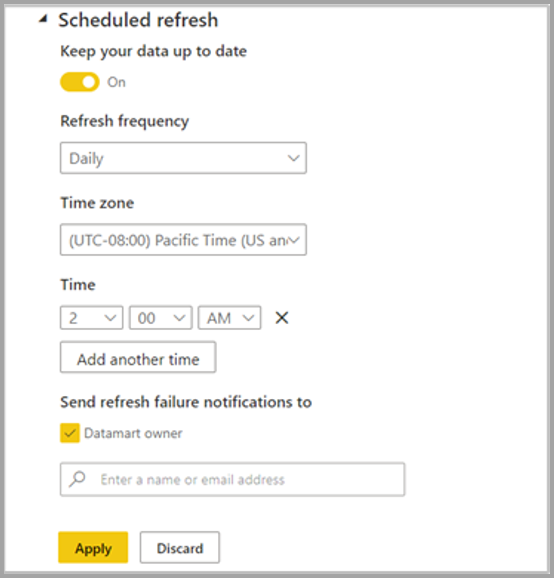
|
| Sensitivity label | Sensitivity label applied on datamart, which also gets propagated on the downstream auto-generated semantic model, reports, and so on.
The sensitivity labels propagation to downstream semantic model, reports won't happen in the following scenarios:
|
The following table shows settings for auto-generated semantic models. When these settings are applied on an auto-generated semantic model, they're also applied to datamart as well.
| Setting | Details |
|---|---|
| Request access |

|
| Q&A |

|
| Query caching |

|
Datamarts considerations and limitations
- Only the datamart owner can add or change data sources corresponding to a datamart. If the current datamart owner is unavailable, another workspace owner can use the Takeover feature to gain access.
- When using datamarts with named connections, the following limitations apply:
- You can only create one cloud connection of a particular path and type, for example, you could only create one SQL plus server/database cloud connection. You can create multiple gateway connections.
- You cannot name or rename cloud data sources; you can name or rename gateway connections.
Related content
This article provided sample data and instructions on how to create and interact with datamarts.
The following articles provide more information about datamarts and Power BI:
- Introduction to datamarts
- Understand datamarts
- Analyzing datamarts
- Create reports with datamarts
- Access control in datamarts
- Datamart administration
For more information about dataflows and transforming data, see the following articles:
