Observability and analytics in Azure Operator 5G Core Preview
Observability has three pillars: metrics, tracing, and logs. Azure Operator 5G Core Preview bundles these observability tools to help you identify, investigate, and resolve problems. In addition, Azure Operator 5G Core alerts provide notifications based on metrics and logs.
Observability overview
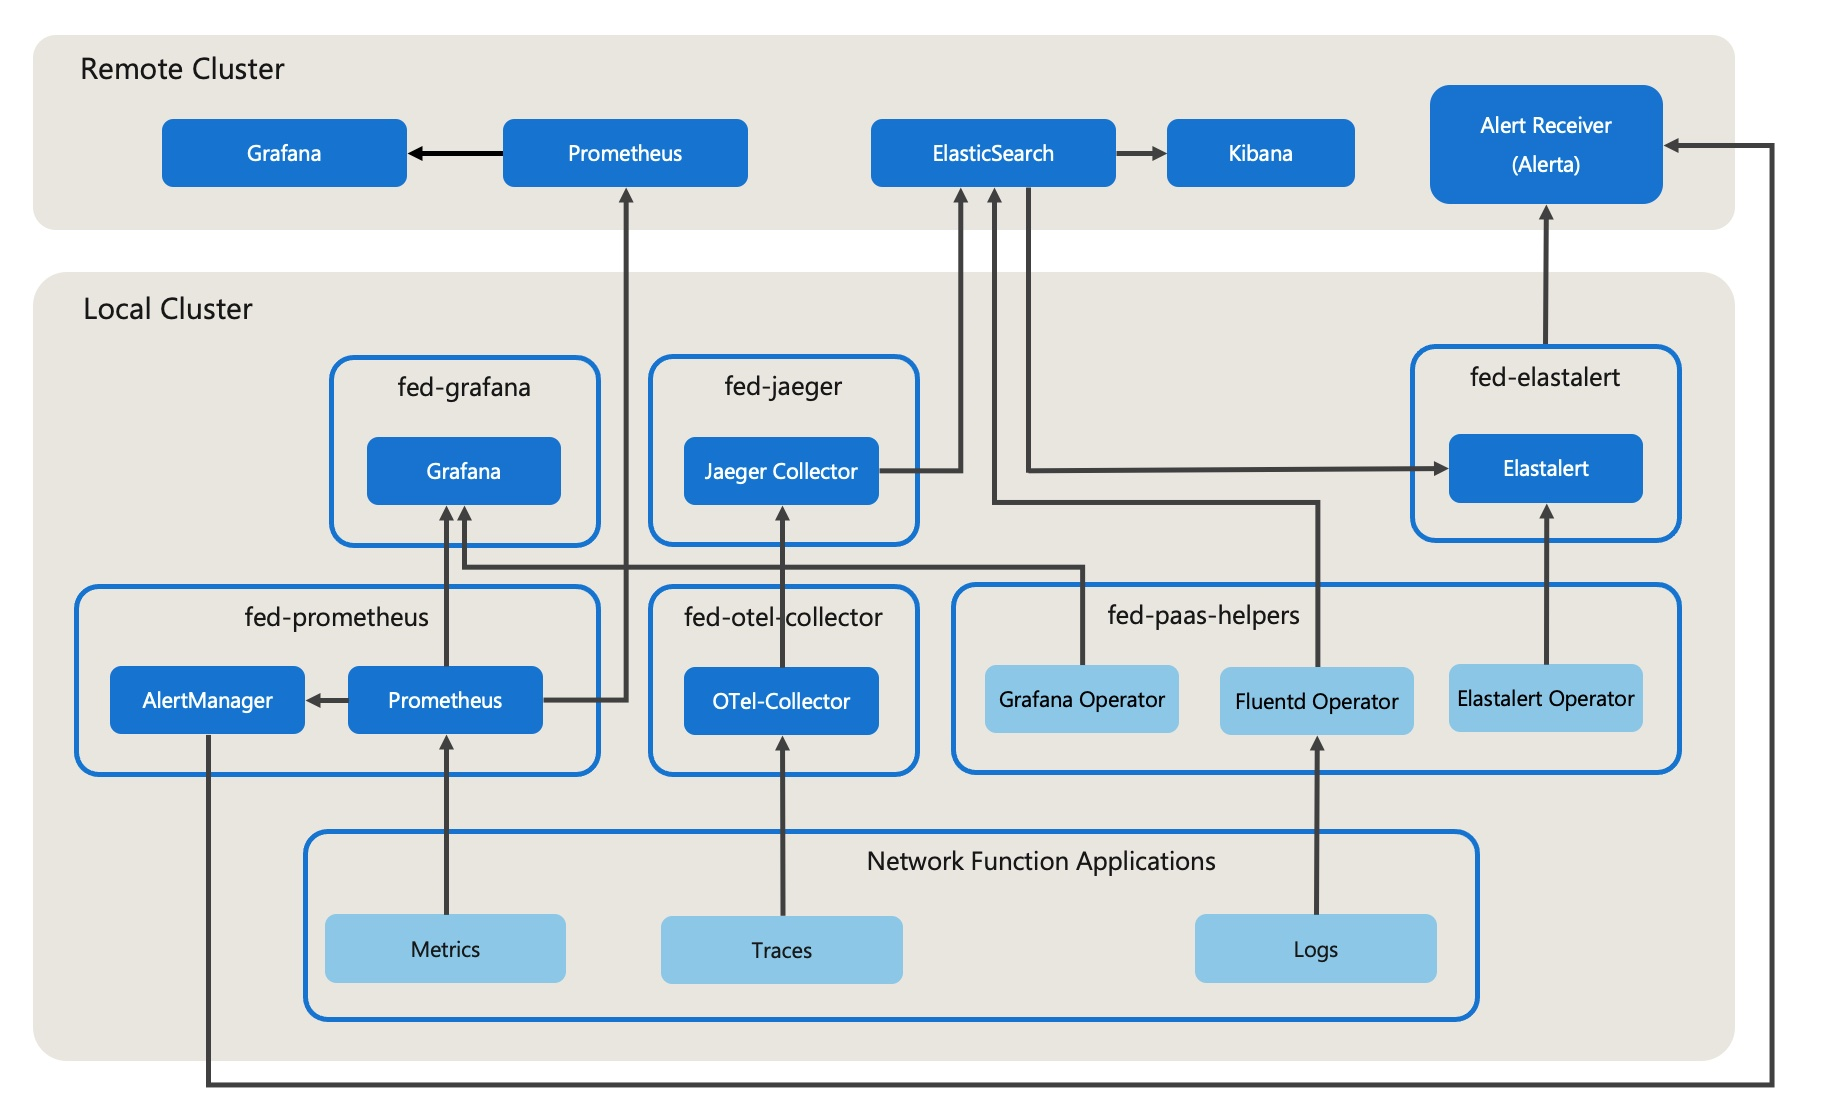
The following components provide observability for Azure Operator 5G Core:
Observability open source components
Azure Operator 5G Core uses the following open source components for observability functions.
| Observability parameters | Open source components |
|---|---|
| Metrics | Prometheus, AlertManager, Grafana |
| Logs | Elasticsearch, Fluentd, and Kibana (EFK); Elastalert |
| Tracing | Jaeger, OpenTelemetry Collector |
Logging framework
Elasticsearch, Fluentd, and Kibana (EFK) provide a distributed logging system used for collecting and visualizing the logs to troubleshoot microservices.
Architecture
The following diagram shows EFK architecture:
Note
Sections of the following linked content is available only to customers with a current Affirmed Networks support agreement. To access the content, you must have Affirmed Networks login credentials. If you need assistance, please speak to the Affirmed Networks Support Team.
The logging framework includes the following components:
Fluentd - Fluentd is an open-source log collector. Fluentd allows you to unify data collection and consumption for better use and understanding of the data. Fluentd is deployed as a DaemonSet in the Kubernetes cluster. It collects the logs in each K8s node and streams the logs to Elasticsearch. See Logs supported by Fluentd.
Elasticsearch - Elasticsearch is an open source, distributed, real-time search back-end. Elasticsearch stores the logs securely and offers an HTTP web interface for log analysis.
Kibana - Kibana is used to visualize the logs stored in Elasticsearch. Kibana pulls the logs from Elasticsearch.
For more information about Elasticsearch and Kibana, see Elastic documentation.
ElastAlert - ElastAlert is a simple framework for alerting on anomalies, spikes, or other patterns of interest from data in Elasticsearch. It works by combining Elasticsearch with two types of components: rule types and alerts. Elasticsearch is periodically queried and the data is passed to the rule type, which determines when a match is found. When a match occurs, one or more alerts are triggered based on the match.
For more information about ElastAlert, see ElastAlert documentation.
Features
The logging framework provides the following features:
Log collection and streaming - Fluentd collects and streams the logs to Elasticsearch.
Audit logs support - Fluentd reads Kube-Apiserver audit logs from the Kubernetes master node and write those logs to Elasticsearch. The
auditlogEnabledflag provided in fed-paas-helpers is used to enable/disable reading of audit logs. If the auditlogEnabled flag is set to true, then Fluentd is also deployed on the master node along with the worker nodes.Event logging - Fluentd creates a separate Elasticsearch index for all the event logs for a particular namespace. This helps to apply rules and search the event logs in a better way. The index starts with the prefix
fluentd-event. All other regular debug logs go into a separate Elasticsearch index, prefixed with the stringfluentd-*.Log storage and analysis - Elasticsearch securely stores the logs and offers a query language to search for and analyze the logs.
Log visualization - Kibana pulls the logs from Elasticsearch and visualizes the logs. Kibana allows creating dashboards to visualize the logs.
Alerting mechanism - ElastAlert provides rules to query Elasticsearch for the logs. When a match occurs, alerts are triggered.
Helm customization
Azure Operator 5G Core provides a default set of Helm values that you can use to deploy the EFK logging framework. You can customize these values to improve scalability and performance if needed.
Observability
This section describes the observability features (dashboards, statistics, logs, and alarms) of the EFK logging framework.
Dashboards
Various dashboards are supported, including:
- Grafana dashboards (see Logging framework dashboards)
- Kibana dashboards (see Kibana dashboard overview)
- Grafana Kibana dashboards (see Kibana Grafana dashboards)
- Fluentd Operator dashboard (see Fluentd operator Grafana dashboard)
- Elasticsearch Grafana dashboard (see Elasticsearch dashboard)
Statistics
For information about supported statistics for EFK components, see:
For information about metrics-based alerts, see:
Events
For information about Elastic events, see Elastic events.
Log visualization
The framework aggregates logs from nodes and applications running inside your Azure Operator 5G Core installation. When logging is enabled, the EFK framework uses Fluentd to aggregate event logs from all applications and nodes into Elasticsearch. The EFK framework also provides a centralized Kibana web UI where users can view the logs or create rich visualizations and dashboards with the aggregated data.
Metrics framework
The metrics framework consists of Prometheus, Grafana, and AlertManager.
Prometheus (the main component) is an open-source, metrics-based monitoring system. It provides a data model and a query language to analyze how the applications and infrastructure are performing. Prometheus collects metrics from instrumented jobs directly and stores all scraped samples in local external storage. Based on defined rules, Prometheus either aggregates and records a new time series from existing data or generates alerts. The AlertManager handles the alerts sent by client applications by deduplicating, grouping, and routing them to the correct receiver integrations.
Grafana provides dashboards to visualize the collected data.
Architecture
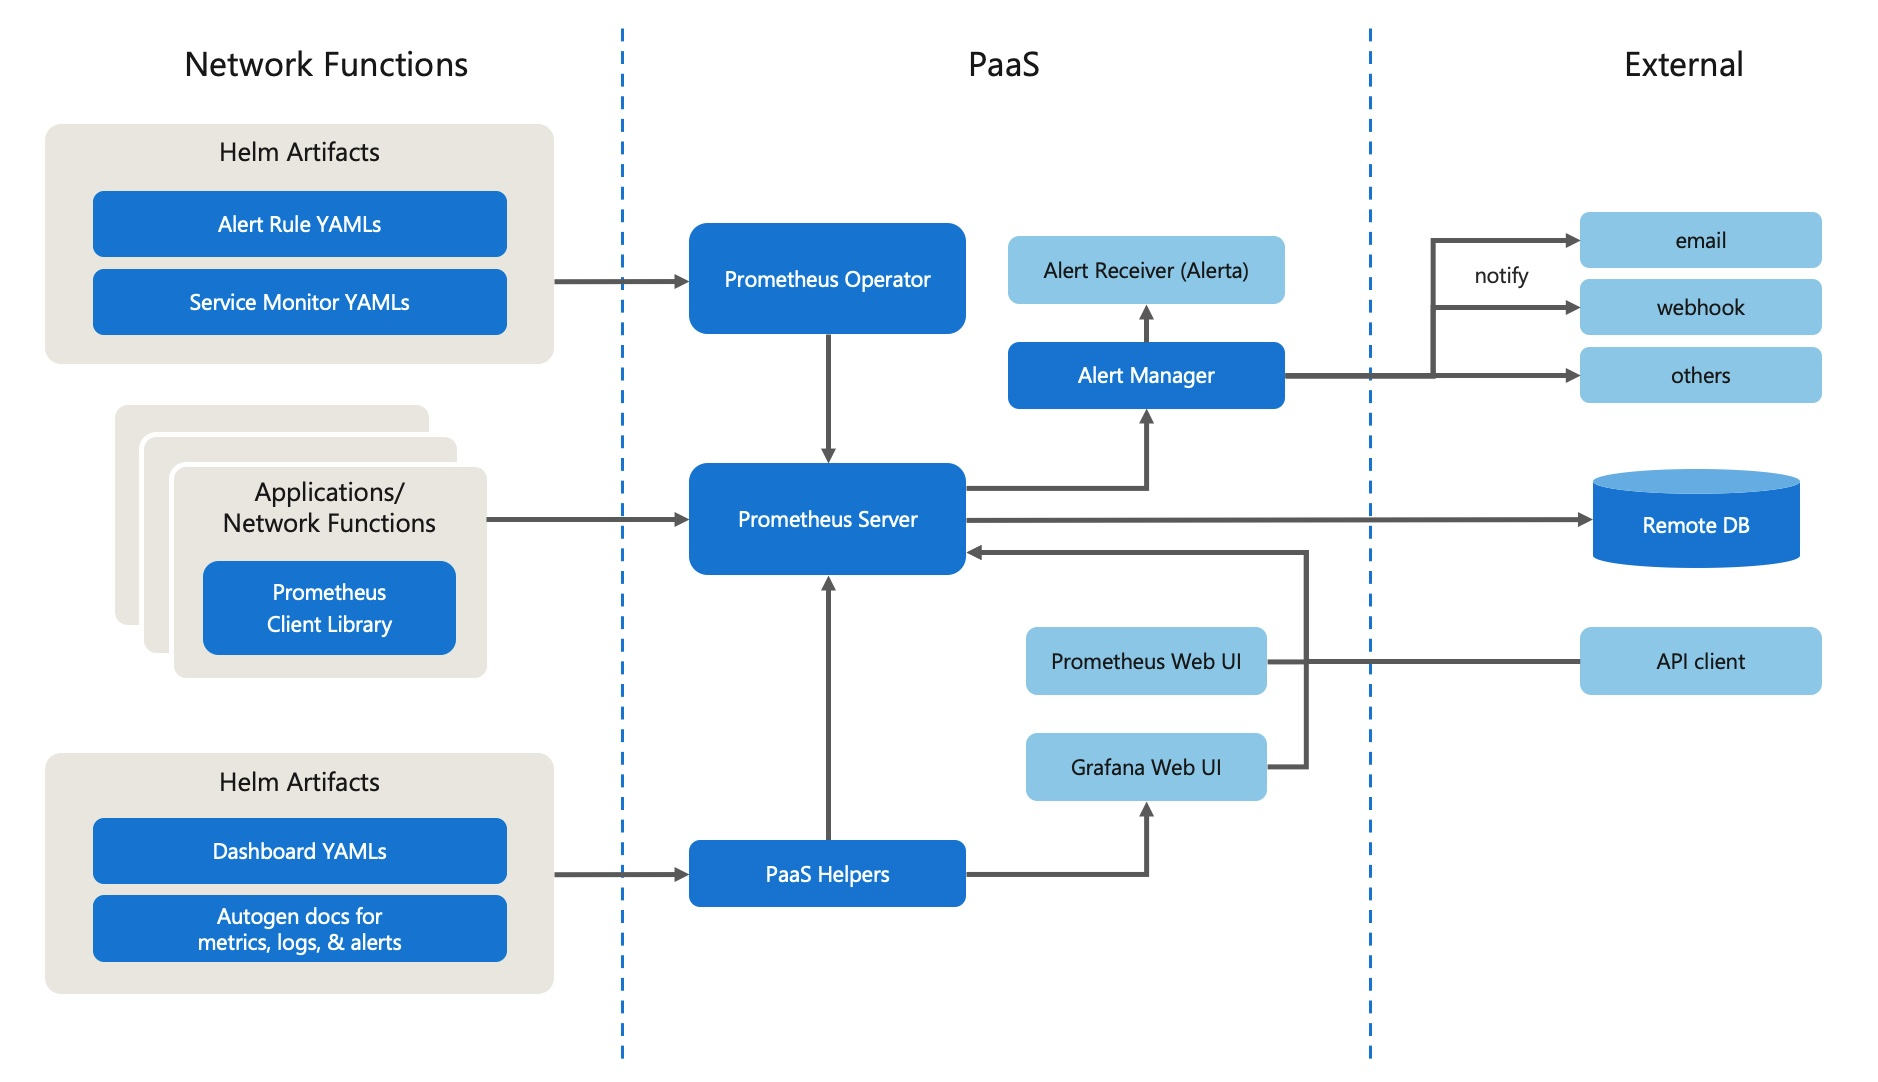
The following diagram shows how the different components of the metrics framework interact with each other.
The core components of the metrics framework are:
- Prometheus server - The Prometheus server collects metrics from configured targets at given intervals, evaluates rule expressions, displays the results, and triggers alerts if certain conditions are true. Azure Operator 5G Core supports integration with the Prometheus server out of the box, with minimal required configuration.
- Client libraries - Client libraries instrument the application code.
- AlertManager - AlertManager handles alerts sent by client applications such as the Prometheus server. It handles deduplicating, grouping, and routing alerts to the correct receiver integrations (email, slack, etc.). AlertManager also supports silencing and inhibition of alerts.
- Grafana - Grafana provides an out of the box set of dashboards rich with 3GPP and other KPIs to query, visualize, and understand the collected data. The Grafana audit feature provides a mechanism to restore or recreate dashboards in the Grafana server when Grafana server pod restarts. The audit feature also helps to delete any stale dashboards from the Grafana server.
Features
The metrics framework supports the following features:
- Multi-dimensional data model with time series data identified by metric name and key/value pairs.
- PromQL, a flexible query language that uses the multi-dimensional data.
- No reliance on distributed storage: single server nodes are autonomous.
- Time series collection using a pull model over HTTP.
- Targets are discovered via service discovery or static configuration.
- Multiple modes of graphing and dashboarding support.
For more information about Prometheus, see Prometheus documentation. For more information about Grafana, see Grafana open source documentation.
Observability
This section describes observability features (dashboards, statistics, logs, and alarms) provided by the metrics framework.
Dashboards
The metrics framework supports the following dashboards:
- Grafana dashboards (see Grafana dashboard)
- Prometheus Grafana dashboards (see Prometheus Grafana dashboard)
Statistics
For information about supported statistics for metrics framework components, see:
For information about Prometheus metrics-based alerts, see Prometheus metrics-based alerts.
Events/Logs
For information about metrics framework events, see:
Metrics-based alerts for network/HTTP failures
Prometheus alert rules generate alerts if HTTP/network failures are detected in the system. The following alerts are generated for network failures.
Application level global alerts:
- IstioGlobalHTTP5xxRatePercentageHigh - An application that is part of the Istio service mesh is responding with 5xx error and the error rate percentage is more than the <configured value > %
- IstioGlobalHTTP4xxRatePercentageHigh - An application is responding with 4xx error and the error rate percentage is more than the <configured_value> %. IstioHTTPRequestLatencyTooHigh: Requests are taking more than the <configured_value> seconds.
Pod and container level alerts:
- HTTPServerError5xxPercentageTooHigh - HTTP server responds with 5xx error and the error percentage is more than the <configured_value> %.
- HTTPServerError4xxPercentageTooHigh - HTTP server responds with 4xx error and the error percentage is more than the <configured_value> %.
- HTTPServerRequestRateTooHigh - The total request received at the HTTP server is more than the <configured_value>.
- HTTPClientRespRcvd5xxPercentageTooHigh - HTTP client response received with 5xx error and the received error percentage is more than the <configured_value> %.
- HTTPClientRespRcvd4xxPercentageTooHigh - HTTP client response received with 4xx error and the received error percentage is more than the <configured_value> %.
Tracing framework
Jaeger tracing with OpenTelemetry Protocol
Azure Operator 5G Core uses the OpenTelemetry Protocol (OTLP) in Jaeger tracing. OTLP replaces the Jaeger agent in fed-paas-helpers. Azure Operator 5G Core deploys the fed-otel_collector federation. The OpenTelemetry (OTEL) Collector runs as part of the fed-otel_collector namespace:
Jaeger tracing uses the following workflow:
- The application with the OTLP client library sends traces to the OTEL Collector on the OTLP GRPC protocol. The OTEL Collector has three components: receivers, processors, and exporters.
- The OTLP GRPC receiver in the OTEL Collector receives traces and sends them to the Jaeger exporter.
- The Jaeger exporter sends traces to the Jaeger collector running as part of fed-jaeger.
- The Jaeger collector stores the traces in Elastic backend storage (fed-elastic).
Related content
- What is Azure Operator 5G Core Preview?
- Quickstart: Deploy Azure Operator 5G Core observability (preview) on Azure Kubernetes Services (AKS)
[def]:


