Inspection of telemetry data with Application Insights
Application Insights is part of Azure Monitor, which is a comprehensive solution for collecting, analyzing, and acting on telemetry data from your cloud and on-premises environments. With Application Insights, you can monitor your application's performance, detect issues, and diagnose problems.
In this example, we will learn how to export telemetry data to Application Insights, and inspect the data in the Application Insights portal.
Exporter
Exporters are responsible for sending telemetry data to a destination. Read more about exporters here. In this example, we use the Azure Monitor exporter to output telemetry data to an Application Insights instance.
Prerequisites
- An Azure OpenAI chat completion deployment.
- An Application Insights instance. Follow the instructions here to create a resource if you don't have one. Copy the connection string for later use.
- The latest .Net SDK for your operating system.
- An Azure OpenAI chat completion deployment.
- An Application Insights instance. Follow the instructions here to create a resource if you don't have one. Copy the connection string for later use.
- Python 3.10, 3.11, or 3.12 installed on your machine.
Note
Semantic Kernel Observability is not yet available for Java.
Setup
Create a new console application
In a terminal, run the following command to create a new console application in C#:
dotnet new console -n TelemetryApplicationInsightsQuickstart
Navigate to the newly created project directory after the command completes.
Install required packages
Semantic Kernel
dotnet add package Microsoft.SemanticKernelOpenTelemetry Console Exporter
dotnet add package Azure.Monitor.OpenTelemetry.Exporter
Create a simple application with Semantic Kernel
From the project directory, open the Program.cs file with your favorite editor. We are going to create a simple application that uses Semantic Kernel to send a prompt to a chat completion model. Replace the existing content with the following code and fill in the required values for deploymentName, endpoint, and apiKey:
using Azure.Monitor.OpenTelemetry.Exporter;

using Microsoft.Extensions.DependencyInjection;
using Microsoft.Extensions.Logging;
using Microsoft.SemanticKernel;
using OpenTelemetry;
using OpenTelemetry.Logs;
using OpenTelemetry.Metrics;
using OpenTelemetry.Resources;
using OpenTelemetry.Trace;

namespace TelemetryApplicationInsightsQuickstart
{
    class Program
    {
        static async Task Main(string[] args)
        {
            // Telemetry setup code goes here

            IKernelBuilder builder = Kernel.CreateBuilder();
            // builder.Services.AddSingleton(loggerFactory);
            builder.AddAzureOpenAIChatCompletion(
                deploymentName: "your-deployment-name",
                endpoint: "your-azure-openai-endpoint",
                apiKey: "your-azure-openai-api-key"
            );

            Kernel kernel = builder.Build();

            var answer = await kernel.InvokePromptAsync(
                "Why is the sky blue in one sentence?"
            );

            Console.WriteLine(answer);
        }
    }
}
Add telemetry
If you run the console app now, you should expect to see a sentence explaining why the sky is blue. To observe the kernel via telemetry, replace the // Telemetry setup code goes here comment with the following code:
// Replace the connection string with your Application Insights connection string
var connectionString = "your-application-insights-connection-string";

var resourceBuilder = ResourceBuilder
    .CreateDefault()
    .AddService("TelemetryApplicationInsightsQuickstart");

// Enable model diagnostics with sensitive data.
AppContext.SetSwitch("Microsoft.SemanticKernel.Experimental.GenAI.EnableOTelDiagnosticsSensitive", true);

using var traceProvider = Sdk.CreateTracerProviderBuilder()
    .SetResourceBuilder(resourceBuilder)
    .AddSource("Microsoft.SemanticKernel*")
    .AddAzureMonitorTraceExporter(options => options.ConnectionString = connectionString)
    .Build();

using var meterProvider = Sdk.CreateMeterProviderBuilder()
    .SetResourceBuilder(resourceBuilder)
    .AddMeter("Microsoft.SemanticKernel*")
    .AddAzureMonitorMetricExporter(options => options.ConnectionString = connectionString)
    .Build();

using var loggerFactory = LoggerFactory.Create(builder =>
{
    // Add OpenTelemetry as a logging provider
    builder.AddOpenTelemetry(options =>
    {
        options.SetResourceBuilder(resourceBuilder);
        options.AddAzureMonitorLogExporter(options => options.ConnectionString = connectionString);
        // Format log messages. This is default to false.
        options.IncludeFormattedMessage = true;
        options.IncludeScopes = true;
    });
    builder.SetMinimumLevel(LogLevel.Information);
});
Finally Uncomment the line // builder.Services.AddSingleton(loggerFactory); to add the logger factory to the builder.
Please refer to this article for more information on the telemetry setup code. The only difference here is that we are using AddAzureMonitor[Trace|Metric|Log]Exporter to export telemetry data to Application Insights.
Create a new Python virtual environment
python -m venv telemetry-application-insights-quickstart
Activate the virtual environment.
telemetry-application-insights-quickstart\Scripts\activate
Install required packages
pip install semantic-kernel azure-monitor-opentelemetry-exporter
Create a simple Python script with Semantic Kernel
Create a new Python script and open it with your favorite editor.
New-Item -Path telemetry_application_insights_quickstart.py -ItemType file
We are going to create a simple Python script that uses Semantic Kernel to send a prompt to a chat completion model. Replace the existing content with the following code and fill in the required values for deployment_name, endpoint, and api_key:
import asyncio
import logging

from azure.monitor.opentelemetry.exporter import (
    AzureMonitorLogExporter,
    AzureMonitorMetricExporter,
    AzureMonitorTraceExporter,
)

from opentelemetry._logs import set_logger_provider
from opentelemetry.metrics import set_meter_provider
from opentelemetry.sdk._logs import LoggerProvider, LoggingHandler
from opentelemetry.sdk._logs.export import BatchLogRecordProcessor
from opentelemetry.sdk.metrics import MeterProvider
from opentelemetry.sdk.metrics.export import PeriodicExportingMetricReader
from opentelemetry.sdk.metrics.view import DropAggregation, View
from opentelemetry.sdk.resources import Resource
from opentelemetry.sdk.trace import TracerProvider
from opentelemetry.sdk.trace.export import BatchSpanProcessor
from opentelemetry.semconv.resource import ResourceAttributes
from opentelemetry.trace import set_tracer_provider

from semantic_kernel import Kernel
from semantic_kernel.connectors.ai.open_ai import AzureChatCompletion


# Telemetry setup code goes here

async def main():
    # Create a kernel and add a service
    kernel = Kernel()
    kernel.add_service(AzureChatCompletion(
        api_key="your-azure-openai-api-key",
        endpoint="your-azure-openai-endpoint",
        deployment_name="your-deployment-name"
    ))

    answer = await kernel.invoke_prompt("Why is the sky blue in one sentence?")
    print(answer)


if __name__ == "__main__":
    asyncio.run(main())
Add telemetry
Environment variables
Please refer to this article for more information on setting up the required environment variables to enable the kernel to emit spans for AI connectors.
Code
If you run the script now, you should expect to see a sentence explaining why the sky is blue. To observe the kernel via telemetry, replace the # Telemetry setup code goes here comment with the following code:
# Replace the connection string with your Application Insights connection string
connection_string = "your-application-insights-connection-string"

# Create a resource to represent the service/sample
resource = Resource.create({ResourceAttributes.SERVICE_NAME: "telemetry-application-insights-quickstart"})


def set_up_logging():
    exporter = AzureMonitorLogExporter(connection_string=connection_string)

    # Create and set a global logger provider for the application.
    logger_provider = LoggerProvider(resource=resource)
    # Log processors are initialized with an exporter which is responsible
    # for sending the telemetry data to a particular backend.
    logger_provider.add_log_record_processor(BatchLogRecordProcessor(exporter))
    # Sets the global default logger provider
    set_logger_provider(logger_provider)

    # Create a logging handler to write logging records, in OTLP format, to the exporter.
    handler = LoggingHandler()
    # Add filters to the handler to only process records from semantic_kernel.
    handler.addFilter(logging.Filter("semantic_kernel"))
    # Attach the handler to the root logger. `getLogger()` with no arguments returns the root logger.
    # Events from all child loggers will be processed by this handler.
    logger = logging.getLogger()
    logger.addHandler(handler)
    logger.setLevel(logging.INFO)


def set_up_tracing():
    exporter = AzureMonitorTraceExporter(connection_string=connection_string)

    # Initialize a trace provider for the application. This is a factory for creating tracers.
    tracer_provider = TracerProvider(resource=resource)
    # Span processors are initialized with an exporter which is responsible
    # for sending the telemetry data to a particular backend.
    tracer_provider.add_span_processor(BatchSpanProcessor(exporter))
    # Sets the global default tracer provider
    set_tracer_provider(tracer_provider)


def set_up_metrics():
    exporter = AzureMonitorMetricExporter(connection_string=connection_string)

    # Initialize a metric provider for the application. This is a factory for creating meters.
    meter_provider = MeterProvider(
        metric_readers=[PeriodicExportingMetricReader(exporter, export_interval_millis=5000)],
        resource=resource,
        views=[
            # Dropping all instrument names except for those starting with "semantic_kernel"
            View(instrument_name="*", aggregation=DropAggregation()),
            View(instrument_name="semantic_kernel*"),
        ],
    )
    # Sets the global default meter provider
    set_meter_provider(meter_provider)


# This must be done before any other telemetry calls
set_up_logging()
set_up_tracing()
set_up_metrics()
Please refer to this article for more information on the telemetry setup code. The only difference here is that we are using AzureMonitor[Trace|Metric|Log]Exporter to export telemetry data to Application Insights.
Note
Semantic Kernel Observability is not yet available for Java.
Run
Run the console application with the following command:
dotnet run
Run the Python script with the following command:
python telemetry_application_insights_quickstart.py
Note
Semantic Kernel Observability is not yet available for Java.
Inspect telemetry data
After running the application, head over to the Application Insights portal to inspect the telemetry data. It may take a few minutes for the data to appear in the portal.
Transaction search
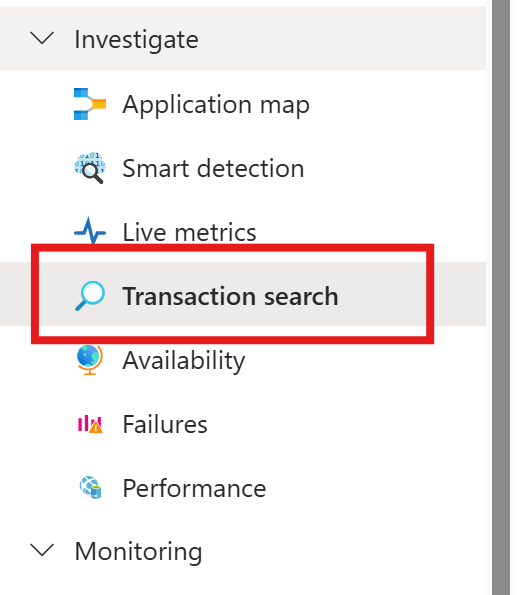
Navigate to the Transaction search tab to view the transactions that have been recorded.

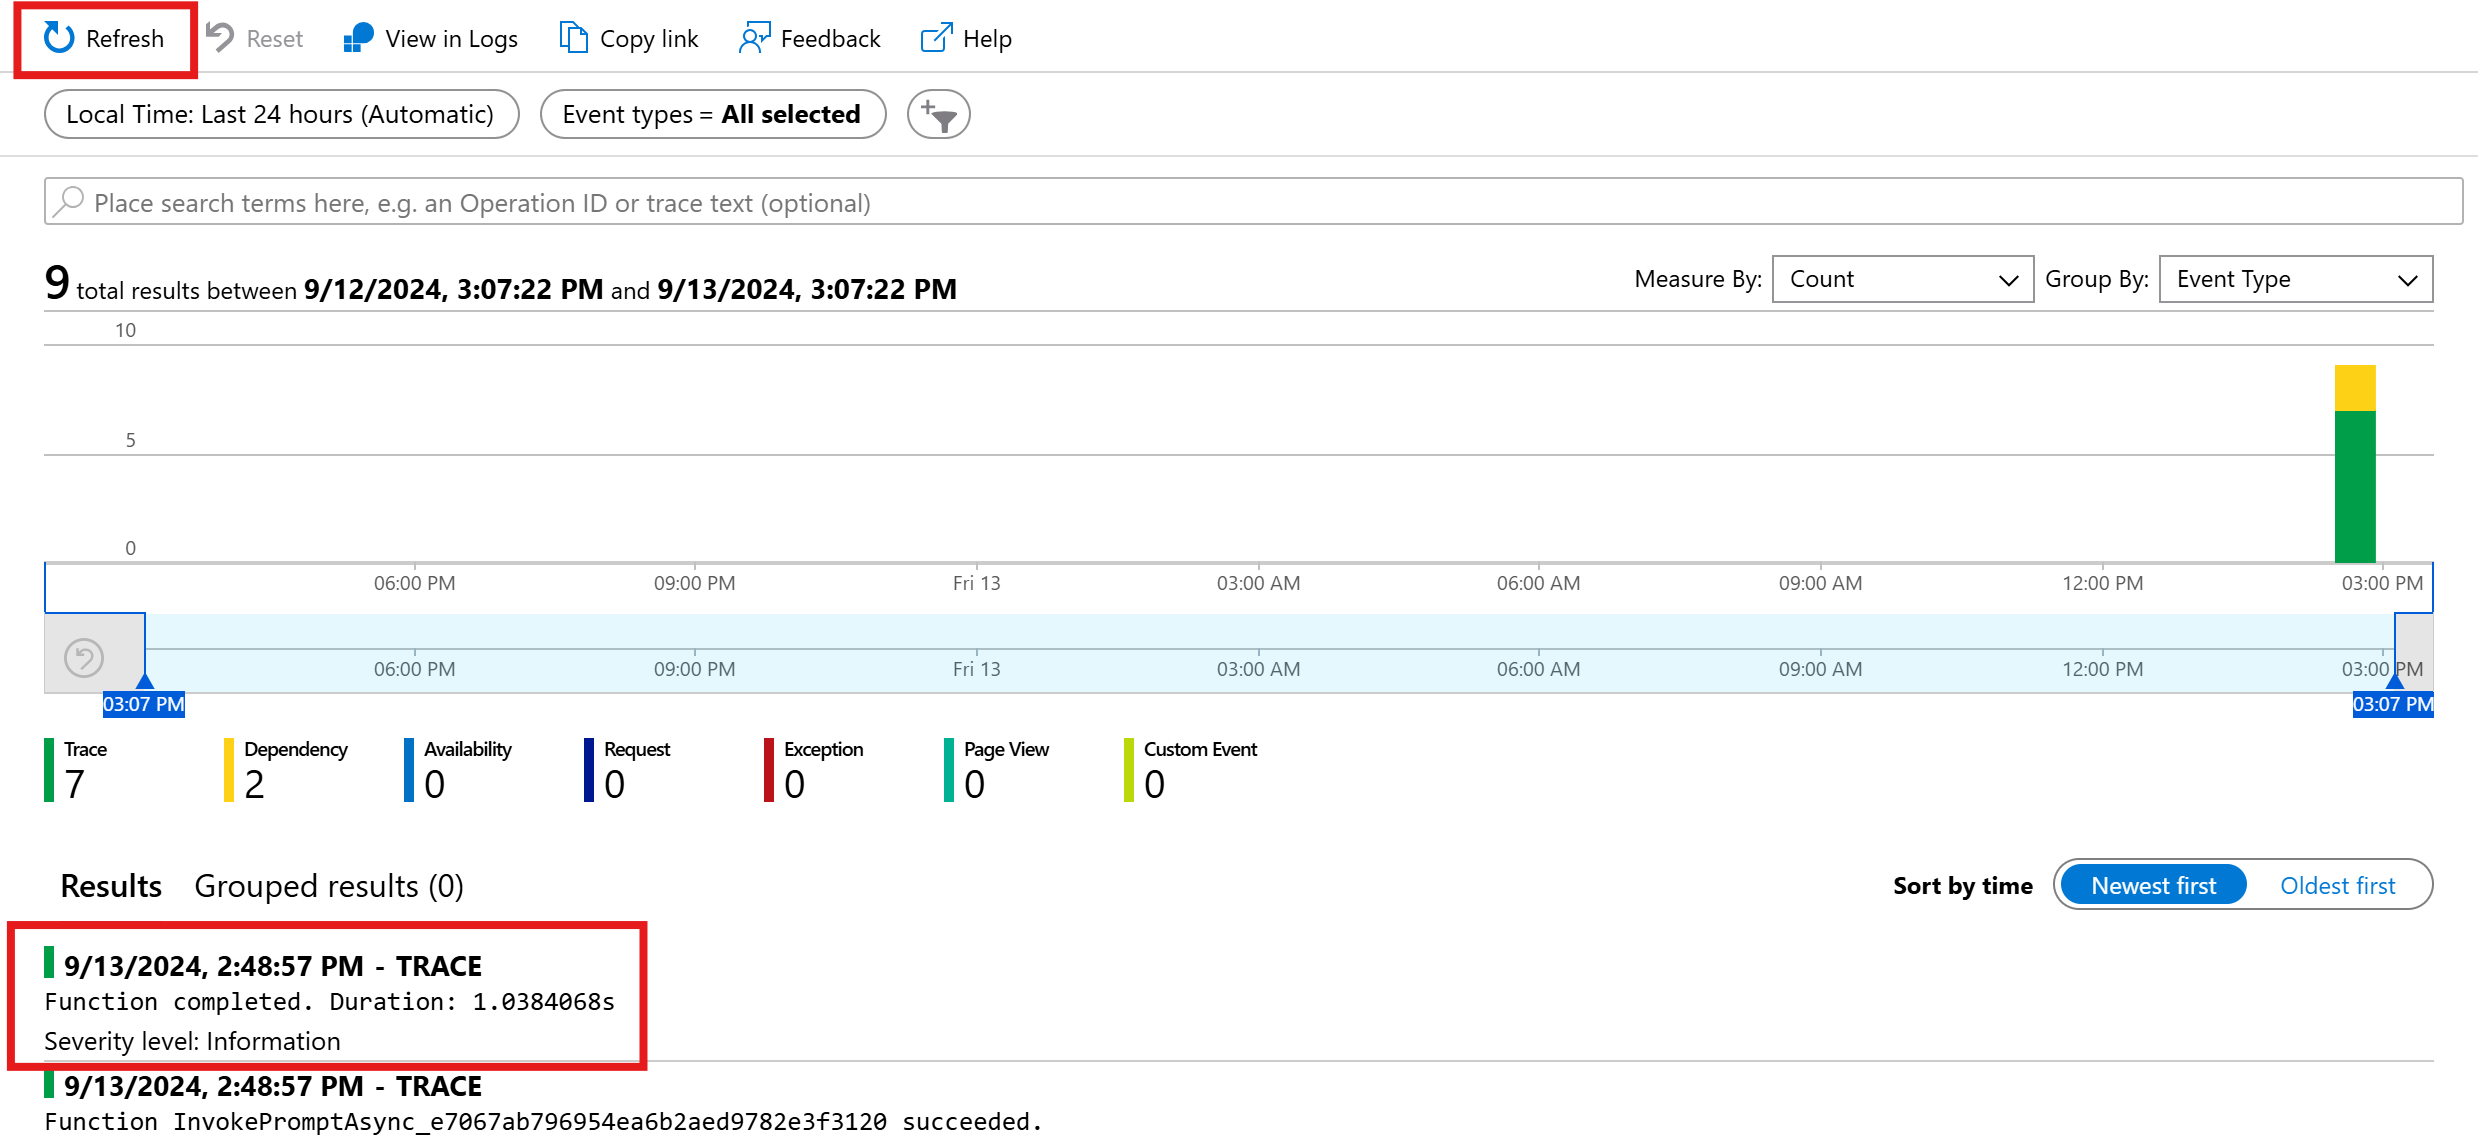
Hit refresh to see the latest transactions. When results appear, click on one of them to see more details.

Toggle between the View all and View timeline button to see all traces and dependencies of the transaction in different views.
Important
Traces represent traditional log entries and OpenTelemetry span events. They are not the same as distributed traces. Dependencies represent the calls to (internal and external) components. Please refer to this article for more information on the data model in Application Insights.
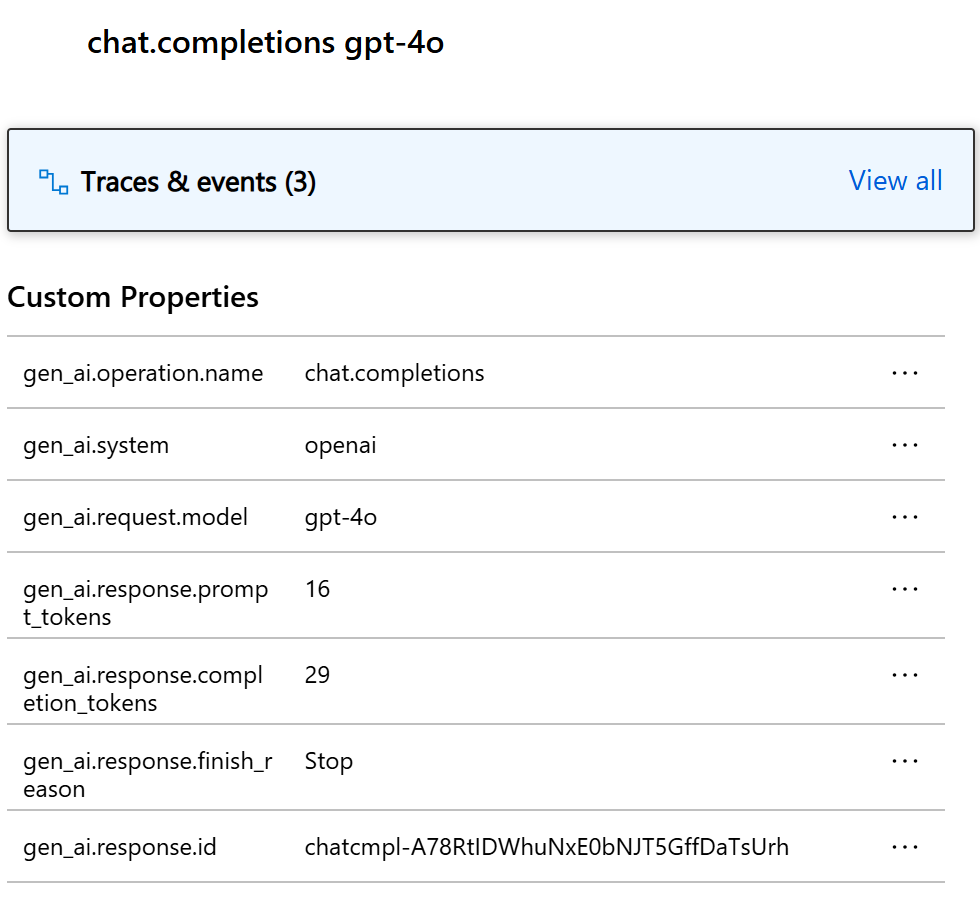
For this particular example, you should see two dependencies and multiple traces. The first dependency represents a kernel function that is created from the prompt. The second dependency represents the call to the Azure OpenAI chat completion model. When you expand the chat.completion {your-deployment-name} dependency, you should see the details of the call. A set of gen_ai attributes are attached to the dependency, which provides additional context about the call.

If you have the switch Microsoft.SemanticKernel.Experimental.GenAI.EnableOTelDiagnosticsSensitive set to true, you will also see two traces that carry the sensitive data of the prompt and the completion result.

Click on them and you will see the prompt and the completion result under the custom properties section.
If you have the environment variable SEMANTICKERNEL_EXPERIMENTAL_GENAI_ENABLE_OTEL_DIAGNOSTICS_SENSITIVE set to true, you will also see two traces that carry the sensitive data of the prompt and the completion result.

Click on them and you will see the prompt and the completion result under the custom properties section.
Log analytics
Transaction search is not the only way to inspect telemetry data. You can also use Log analytics to query and analyze the data. Navigate to the Logs under Monitoring to start.
Follow this document to start exploring the log analytics interface.
Below are some sample queries you can use for this example:
// Retrieves the total number of completion and prompt tokens used for the model if you run the application multiple times.
dependencies
| where name startswith "chat"
| project model = customDimensions["gen_ai.request.model"], completion_token = toint(customDimensions["gen_ai.response.completion_tokens"]), prompt_token = toint(customDimensions["gen_ai.response.prompt_tokens"])
| where model == "gpt-4o"
| project completion_token, prompt_token
| summarize total_completion_tokens = sum(completion_token), total_prompt_tokens = sum(prompt_token)
// Retrieves all the prompts and completions and their corresponding token usage.
dependencies
| where name startswith "chat"
| project timestamp, operation_Id, name, completion_token = customDimensions["gen_ai.response.completion_tokens"], prompt_token = customDimensions["gen_ai.response.prompt_tokens"]
| join traces on operation_Id
| where message startswith "gen_ai"
|project timestamp, messages = customDimensions, token=iff(customDimensions contains "gen_ai.prompt", prompt_token, completion_token)

Next steps
Now that you have successfully output telemetry data to Application Insights, you can explore more features of Semantic Kernel that can help you monitor and diagnose your application: