Review cluster logs with Kibana Dashboard
This article describes how to visualize the logs an application inside SQL Server Big Data Clusters. SQL Server Big Data Clusters use Fluent Bit, an open-source log processor and forwarder. Fluent Bit fetches the logs from big data cluster components in the cluster and stores them in Elastic Stack Elasticsearch. From Kibana Dashboard, you can visualize and search the log of your interest.
Important
The Microsoft SQL Server 2019 Big Data Clusters add-on will be retired. Support for SQL Server 2019 Big Data Clusters will end on February 28, 2025. All existing users of SQL Server 2019 with Software Assurance will be fully supported on the platform and the software will continue to be maintained through SQL Server cumulative updates until that time. For more information, see the announcement blog post and Big data options on the Microsoft SQL Server platform.
Logs stored in Elasticsearch
Big Data Cluster-related logs stored in Elasticsearch includes the standard output and error logs of all services, including SQL Server, Spark, HDFS, and platform services.
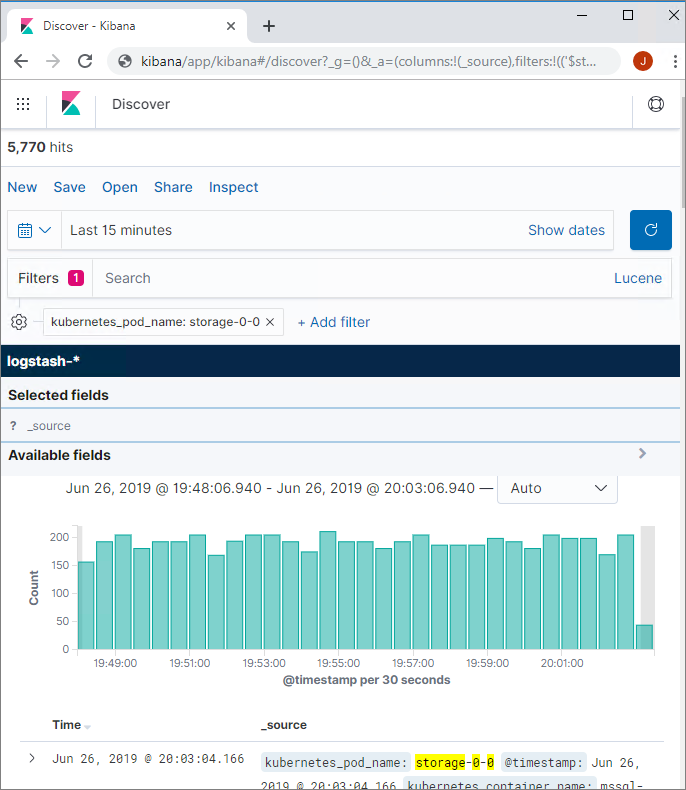
Those logs can be searched by components From Kibana Dashboard. You can use filters such as 'kubernetes_container_name', 'kubernetes_pod_name', 'log_filename' and 'service_name' to help you quickly visualize all the logs such as logs from Big Data Clusters controller, from SQL Server, or any logs from different pods, services, and more.
Specifically, the controller log records the status and process of the cluster deployments and cluster events by filtering 'service_name: controller'. For those who look into SQL Server Big Data Clusters in AD mode, you might find the security-support log to be quite useful, it records the events during the process Big Data Cluster obtains AD tokens from the on-premises Active Directory(AD) domain controller, you can access it by filtering 'service_name: secsupp' under the controller log.
Prerequisites
Capabilities
In SQL Server 2019 (15.x) you can create, delete, describe, initialize, list run and update your application. The following table describes the application deployment commands that you can use with azdata.
| Command | Description |
|---|---|
azdata bdc endpoint list |
Lists the endpoints for the SQL Server Big Data Clusters. |
You can use the following example to list the endpoint of Kibana Dashboard:
azdata bdc endpoint list --endpoint-name logsui
The output will give you the endpoint, which you can use your cluster username and password to sign in.

The link to a Kibana dashboard:

Important
The Internet Explorer browser and older Microsoft Edge browsers are not compatible with Kibana. You will see a blank page when loading the dashboards using an unsupported browser. Consider the Chromium-based Microsoft Edge, or review supported browsers for Kibana.
Related content
For more information about SQL Server Big Data Clusters, see Introducing SQL Server 2019 Big Data Clusters.