Exercise: Add a new tile
You created a dashboard directly from a query in the Azure Data Explorer web UI. In this unit, you add a new tile to an existing dashboard.
Add a new tile
Now, let's add another tile to this dashboard. First, you need to switch from viewing mode to editing mode.
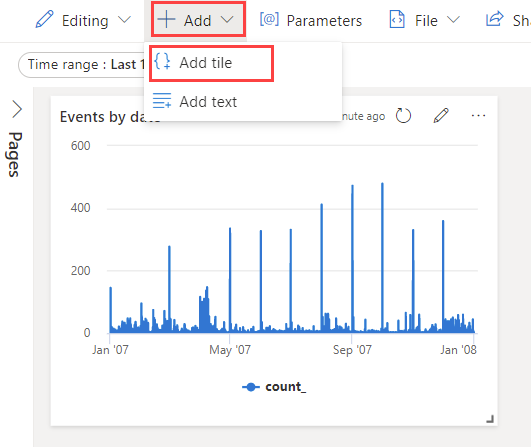
Select Viewing and toggle the mode to Editing.

Select +Add > Add tile.

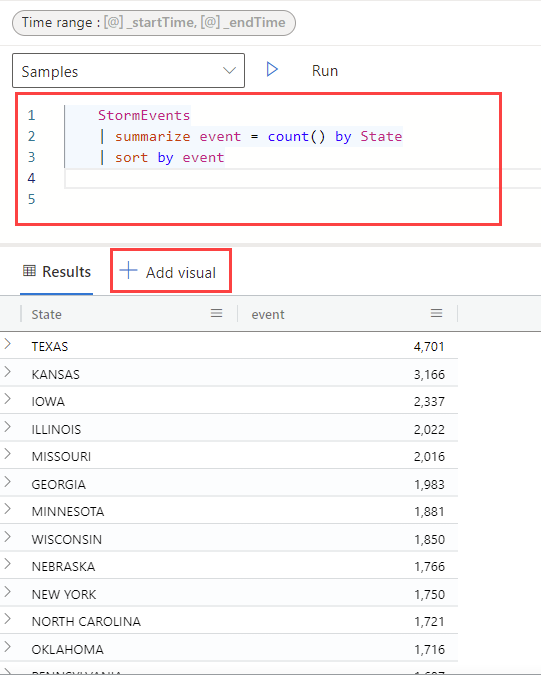
Copy the following query into the query editor:
StormEvents
| summarize event = count() by State
| sort by event
Run the query by selecting the Run button or by pressing Shift+Enter.
Select + Add visual.

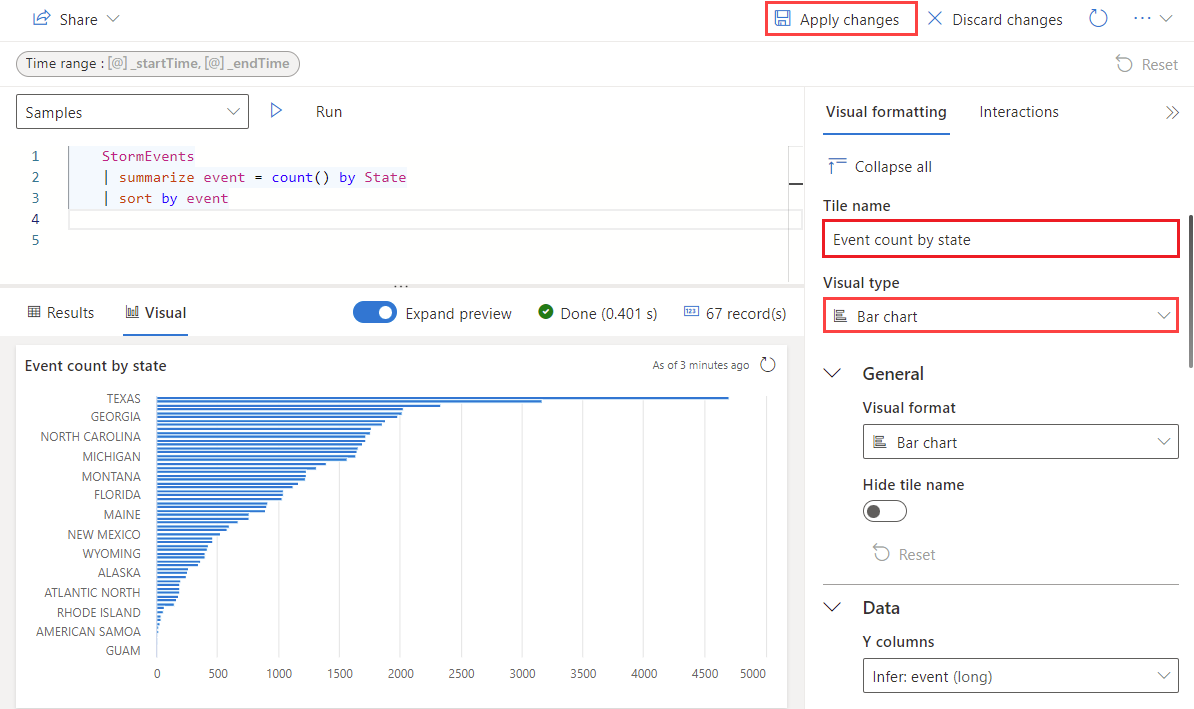
The Visual formatting pane opens. Select Visual type > Bar chart and change the Tile name to Event count by state.

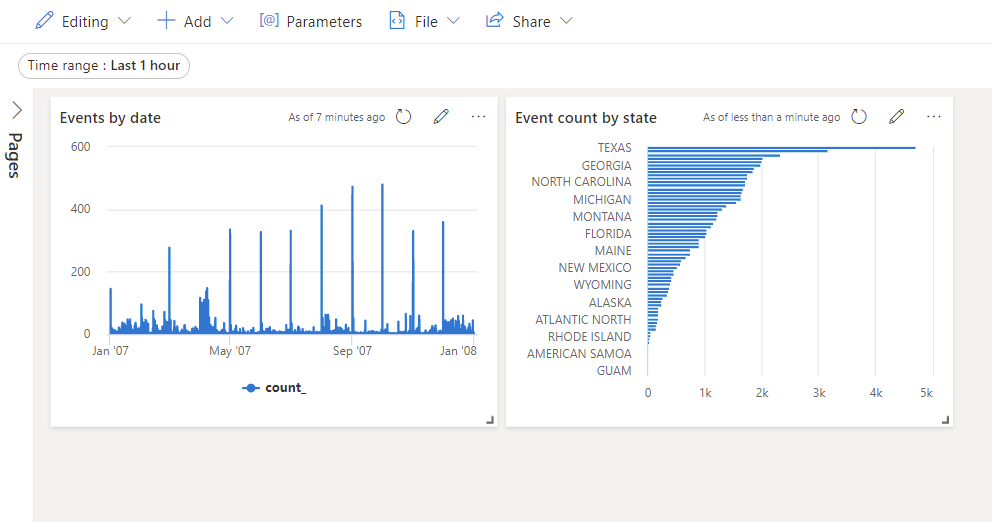
Select Apply changes to create a new tile and view the updated dashboard.

Save the entire dashboard by selecting the Save icon in the upper right corner.
Congratulations! You created a dashboard of insights.