Explore Query Performance Insight
Identifying which queries are consuming the most resources is the first step in any database performance tuning endeavor. In older versions of SQL Server, this required extensive tracing and a series of complex SQL scripts, which could make the process of data gathering cumbersome.
Identify problematic queries
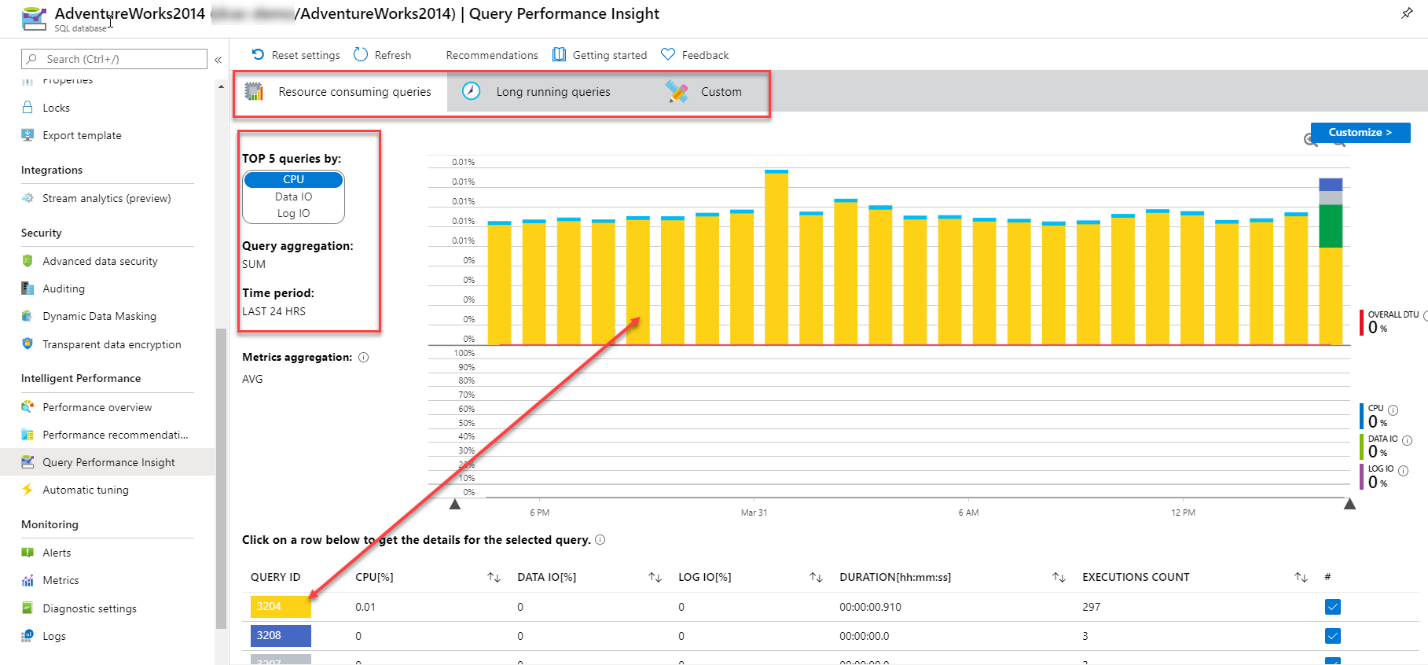
Azure SQL Database offers a tool called Query Performance Insight, that allows the administrator to quickly identity expensive queries. You can navigate to Query Performance Insight in the main blade for your Azure SQL Database in the Intelligent Performance section.
When you launch Query Performance Insight, you’ll discover three buttons to allow you to filter for long running queries, top resource consuming queries, or a custom filter. The default value is Resource Consuming Queries. This tab will show you the top five queries sorted by the particular resource that you select on the left. In this case, it was sorted by CPU. You also have other options of sorting by Data IO and Log IO metrics.
You can drill into individual queries by clicking on the row within the lower grid. Each row will be identified with a unique color that correlates to the color within the bar graph above it.
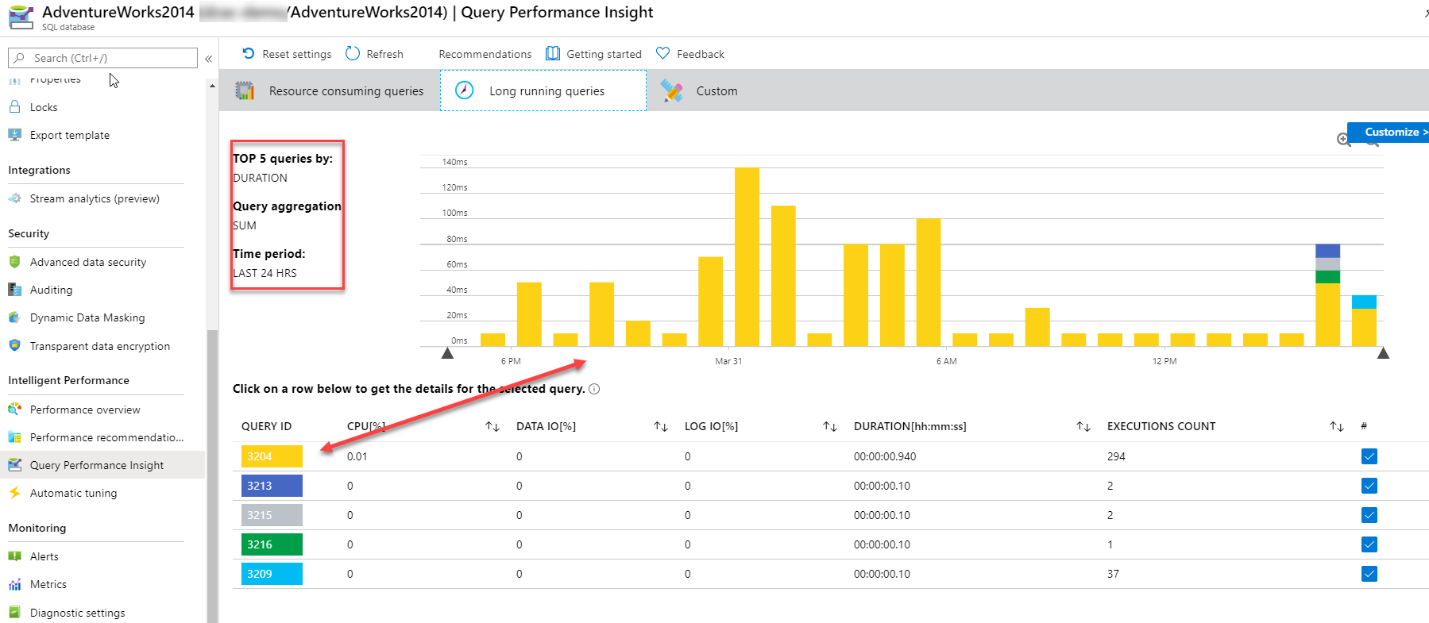
Switching to Long Running Queries, you can see a similar layout as before. In this case, the metrics are limited to the top five queries sorted by duration from the previous 24 hours and is a sum aggregation. In the grid below the graph, you can examine specific queries by clicking on the row.
By switching to the custom tab, there's a little more flexibility compared to the other two options.
Within this tab, we can further define how we wish to examine performance data. It offers us several drop-down menus that will drive the visual representation of the data. The key metrics are CPU, Log IO, Data IO, and memory. These metrics are the aspects of database performance, the upper limits of which are determined by the service tier and compute resources of your Azure SQL Database.
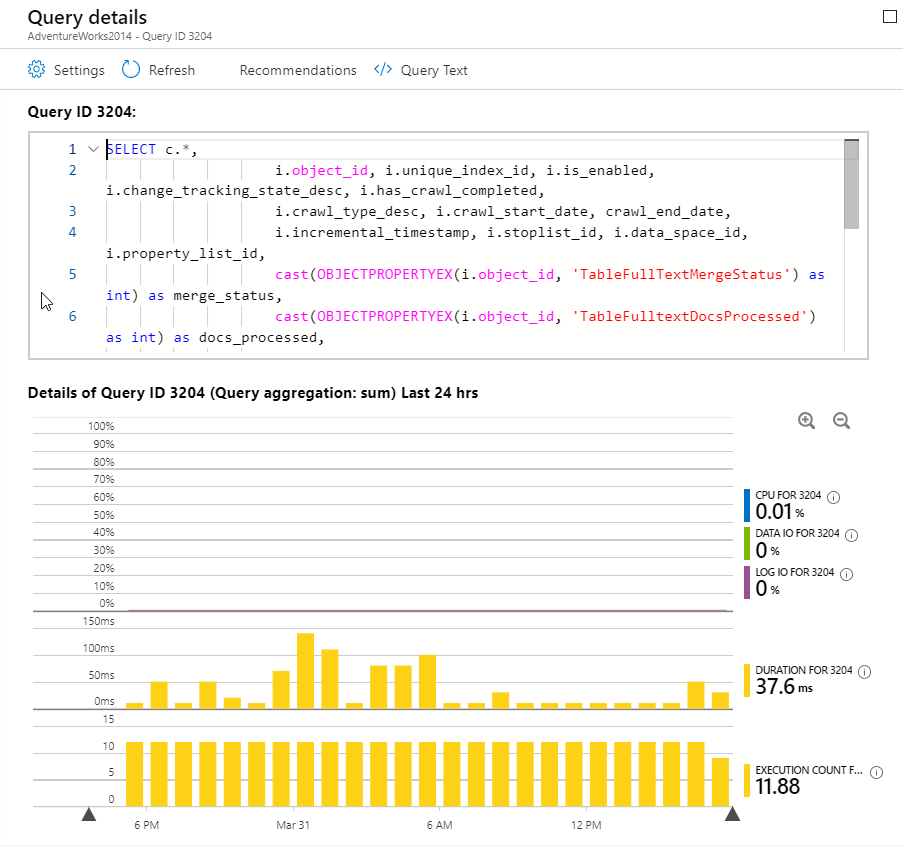
If we drill into an individual query, we'll be able to see the query ID and the query itself, as well as the query aggregation type and associated time period. Furthermore, the query ID also correlates to the query ID located within the Query Store. Metrics gleaned from Query Performance Insights can then be easily located within the Query Store itself for deeper analysis or possibly problem resolution if needed.

While Query Performance Insight doesn't show the query’s execution plan, you can quickly identify that query, and use the information to extract the plan from the Query Store in your database.


