Recommend a configuration for performance requirements
Virtual machines can be monitored for availability and performance with Azure Monitor like any other Azure resource. However, they're unique from other resources since you also need to monitor the guest operating and system and the workloads that run in it.
Differences from other Azure resources
You can collect and act on the same monitoring data from Azure virtual machines as you would monitoring Azure resources with Azure Monitor with the following differences:
- Platform metrics are collected automatically for virtual machines but only for the virtual machine host. You need an agent to collect performance data from the guest operating system.
- Virtual machines don't generate resource logs to provide insight into operations performed within an Azure resource. You use an agent to collect log data from the guest operating system.
- You can create diagnostic settings for a virtual machine to send platform metrics to other destinations such as storage and Event Hubs, but you can't configure these diagnostic settings in the Azure portal.
Monitoring data
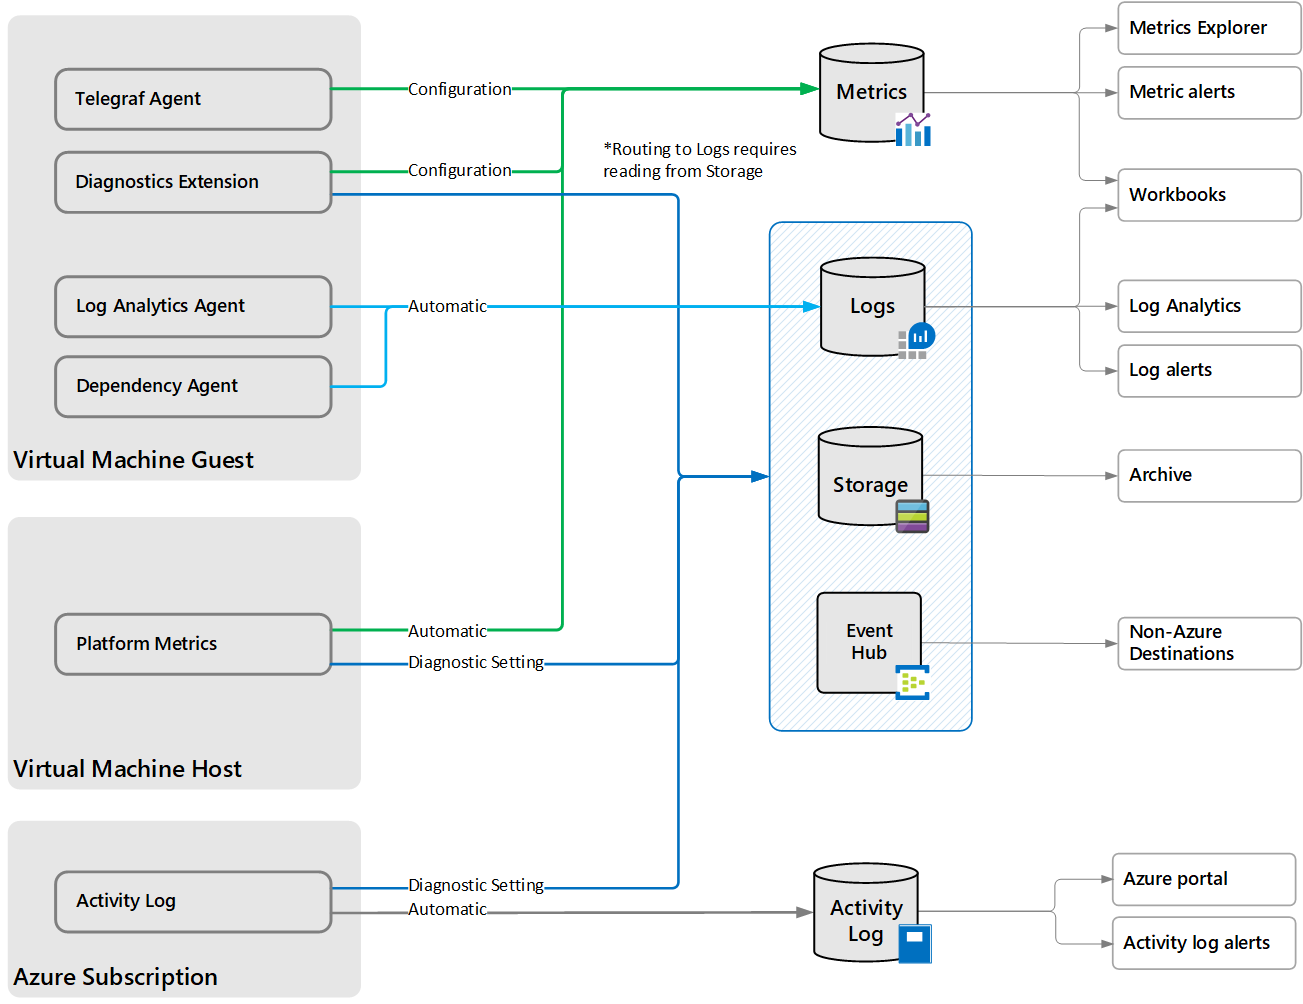
Virtual machines in Azure generate logs and metrics as shown in the following diagram.

Virtual machine host
Virtual machines in Azure provide information for the virtual machine host as described in Monitoring data.
- Platform metrics - Numerical values that are automatically collected at regular intervals and describe some aspect of a resource at a particular time. Platform metrics are collected for the virtual machine host, but you require the diagnostics extension to collect metrics for the guest operating system.
- Activity log - Provides insight for each Azure resource in the subscription from the outside (the management plane). For a virtual machine, such information as when it was started and any configuration changes.
Guest operating system
To collect data from the guest operating system of a virtual machine, and agent running on each virtual machine sends data to Azure Monitor. Agents are available for Azure Monitor with each collecting different data and writing data to different locations.
- Log Analytics agent - Available for virtual machines in Azure, other cloud environments, and on-premises. Collects data to Azure Monitor Logs. Supports Azure Monitor for VMs and monitoring solutions. The same agent used for System Center Operations Manager.
- Dependency agent - Collects data about the processes running on the virtual machine and their dependencies. Relies on the Log Analytics agent to transmit data into Azure and supports Azure Monitor for VMs, Service Map, and Wire Data 2.0 solutions.
- Azure Diagnostic extension - Available for Azure Monitor virtual machines only. Can collect data to multiple locations but primarily used to collect guest performance data into Azure Monitor Metrics for Windows virtual machines.
- Telegraf agent - Collect performance data from Linux VMs into Azure Monitor Metrics.
Configuration requirements
To enable all features of Azure Monitor for monitoring a virtual machine, you need to collect monitoring data from the virtual machine host and guest operating system to both Azure Monitor Metrics and Azure Monitor Logs. The following table lists the configuration that must be performed to enable this collection.
Configuration step
Actions completed
Features enabled
No configuration.
Host platform metrics collected to Metrics.Activity log collected.
Metrics explorer for host.Metrics alerts for host.Activity log alerts.
Enable Azure Monitor for VMs.
Log Analytics agent installed.Dependency agent installed.Guest performance data collected to Logs.Process and dependency details collected to Logs.
Performance charts and workbooks for guest performance data.Log queries for guest performance data.Log alerts for guest performance data.Dependency map.
Install the diagnostics extension and telegraf agent.
Guest performance data collected to Metrics.
Metrics explorer for guest.Metrics alerts for guest.