Monitor your networks using Azure network watcher
Azure Network Watcher
Azure Network Watcher is a regional service that enables you to monitor and diagnose network conditions. Monitoring enables you to diagnose problems at an end-to-end network level view. Network diagnostic and visualization tools available with Network Watcher help you understand, diagnose, and gain insights to your network in Azure. Network Watcher is designed to monitor and repair the network health of IaaS products which includes virtual machines, virtual networks, Application Gateways, and Load Balancers.
Azure Network Watcher example scenarios
- Automate remote network monitoring with packet capture. Monitor and diagnose networking issues without logging in to your virtual machines (VMs) using Network Watcher. Trigger packet capture by setting alerts, and gain access to real-time performance information at the packet level. When you observe an issue, you can investigate in detail for better diagnoses.
- Gain insight into your network traffic using flow logs. Build a deeper understanding of your network traffic pattern using Network Security Group flow logs. Information provided by flow logs helps you gather data for compliance, auditing and monitoring your network security profile.
- Diagnose VPN connectivity issues. Network Watcher provides you with the ability to diagnose your most common VPN Gateway and Connections issues. Allowing you to identify the issue and use the detailed logs to further investigate.
Azure Network Watcher tools
Network Topology. The topology capability generates a visual diagram of the resources in a virtual network, and the relationships between the resources.
Verify IP Flow. Quickly diagnose connectivity issues from or to the internet and from or to the on-premises environment. For example, confirming if a security rule is blocking ingress or egress traffic to or from a virtual machine. IP flow verify is ideal for making sure security rules are being correctly applied.
Next Hop. Determines if traffic is being directed to the intended destination by showing the next hop. This information helps determine if networking routing is correctly configured. Depending on your situation the next hop could be Internet, Virtual Appliance, Virtual Network Gateway, VNet Local, VNet Peering, or None. None lets you know that while there may be a valid system route to the destination, there's no next hop to route the traffic to the destination.
Effective security rules. Network Security Groups are associated at a subnet level or at a NIC level. Effective security rules view returns all the configured NSGs and rules that are associated for a virtual machine. Using the Effective security rules view, you can assess a VM for network vulnerabilities such as open ports.
VPN Diagnostics. VPN Diagnostics returns a wealth of information to help troubleshoot gateways and connections. Summary information includes connection statistics, CPU and memory information, IKE security errors, packet drops, and buffers and events.
Packet Capture. Packet capture allows you to capture sessions to track traffic to and from a virtual machine. Packet capture helps to diagnose network anomalies both reactively and proactively. Other uses include gathering network statistics, gaining information on network intrusions, and to debug client-server communications.
Connection Troubleshoot. Azure Network Watcher Connection Troubleshoot is a more recent addition to the Network Watcher suite of networking tools and capabilities. Connection Troubleshoot provides network performance data to help troubleshoot connectivity issues.
NSG Flow Logs. NSG Flow Logs maps IP traffic through a network security group. Common use cases for NSG flow logs include:
- Network Monitoring. Identify unknown or undesired traffic. Monitor traffic levels and bandwidth consumption. Filter flow logs by IP and port to understand application behavior. Export Flow Logs to analytics and visualization tools of your choice to set up monitoring dashboards.
- Usage monitoring and optimization. Identify top talkers in your network. Combine with other data to identify cross-region traffic. Understand traffic growth for capacity forecasting. Use data to remove overtly restrictive traffic rules.
- Compliance. Use flow data to verify network isolation and compliance with enterprise access rules.
- Network forensics and security analysis. Analyze network flows from compromised IPs and network interfaces. Export flow logs to any SIEM or IDS tool of your choice.
Connection Monitor overview
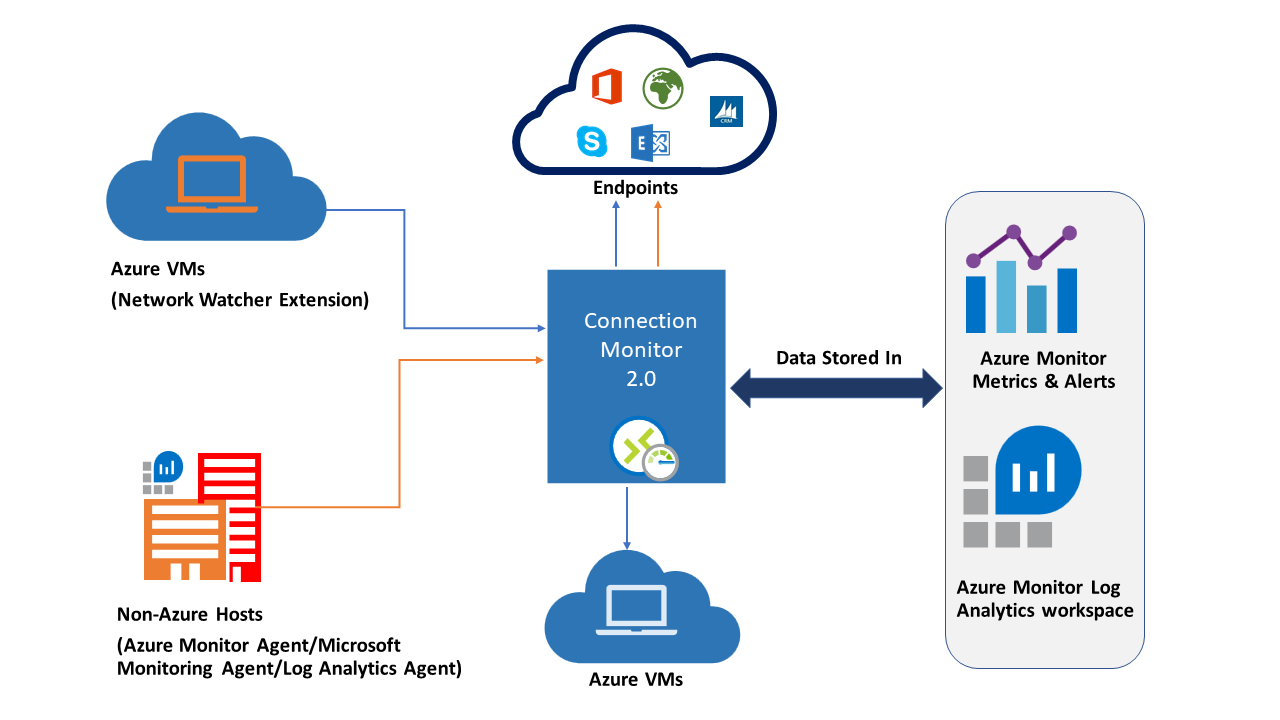
Connection Monitor provides unified end-to-end connection monitoring in Azure Network Watcher. The Connection Monitor feature supports hybrid and Azure cloud deployments. Network Watcher provides tools to monitor, diagnose, and view connectivity-related metrics for your Azure deployments.

Here are some benefits of Connection Monitor:
- Unified, intuitive experience for Azure and hybrid monitoring needs.
- Cross-region, cross-workspace connectivity monitoring.
- Higher probing frequencies and better visibility into network performance.
- Faster alerting for your hybrid deployments.
- Support for connectivity checks that are based on HTTP, TCP, and ICMP.
- Metrics and Log Analytics support for both Azure and non-Azure test setups.
Here are some use cases for Connection Monitor:
- Your front-end web server VM communicates with a database server VM in a multi-tier application. You want to check network connectivity between the two VMs.
- You want VMs in the East US region to ping VMs in the Central US region, and you want to compare cross-region network latencies.
- You have multiple on-premises office sites in Seattle, Washington, and in Ashburn, Virginia. Your office sites connect to Microsoft 365 URLs. For your users of Microsoft 365 URLs, compare the latencies between Seattle and Ashburn.
- Your hybrid application needs connectivity to an Azure Storage endpoint. Your on-premises site and your Azure application connect to the same Azure Storage endpoint. You want to compare the latencies of the on-premises site to the latencies of the Azure application.
- You want to check the connectivity between your on-premises setups and the Azure VMs that host your cloud application.
Connection Monitor components
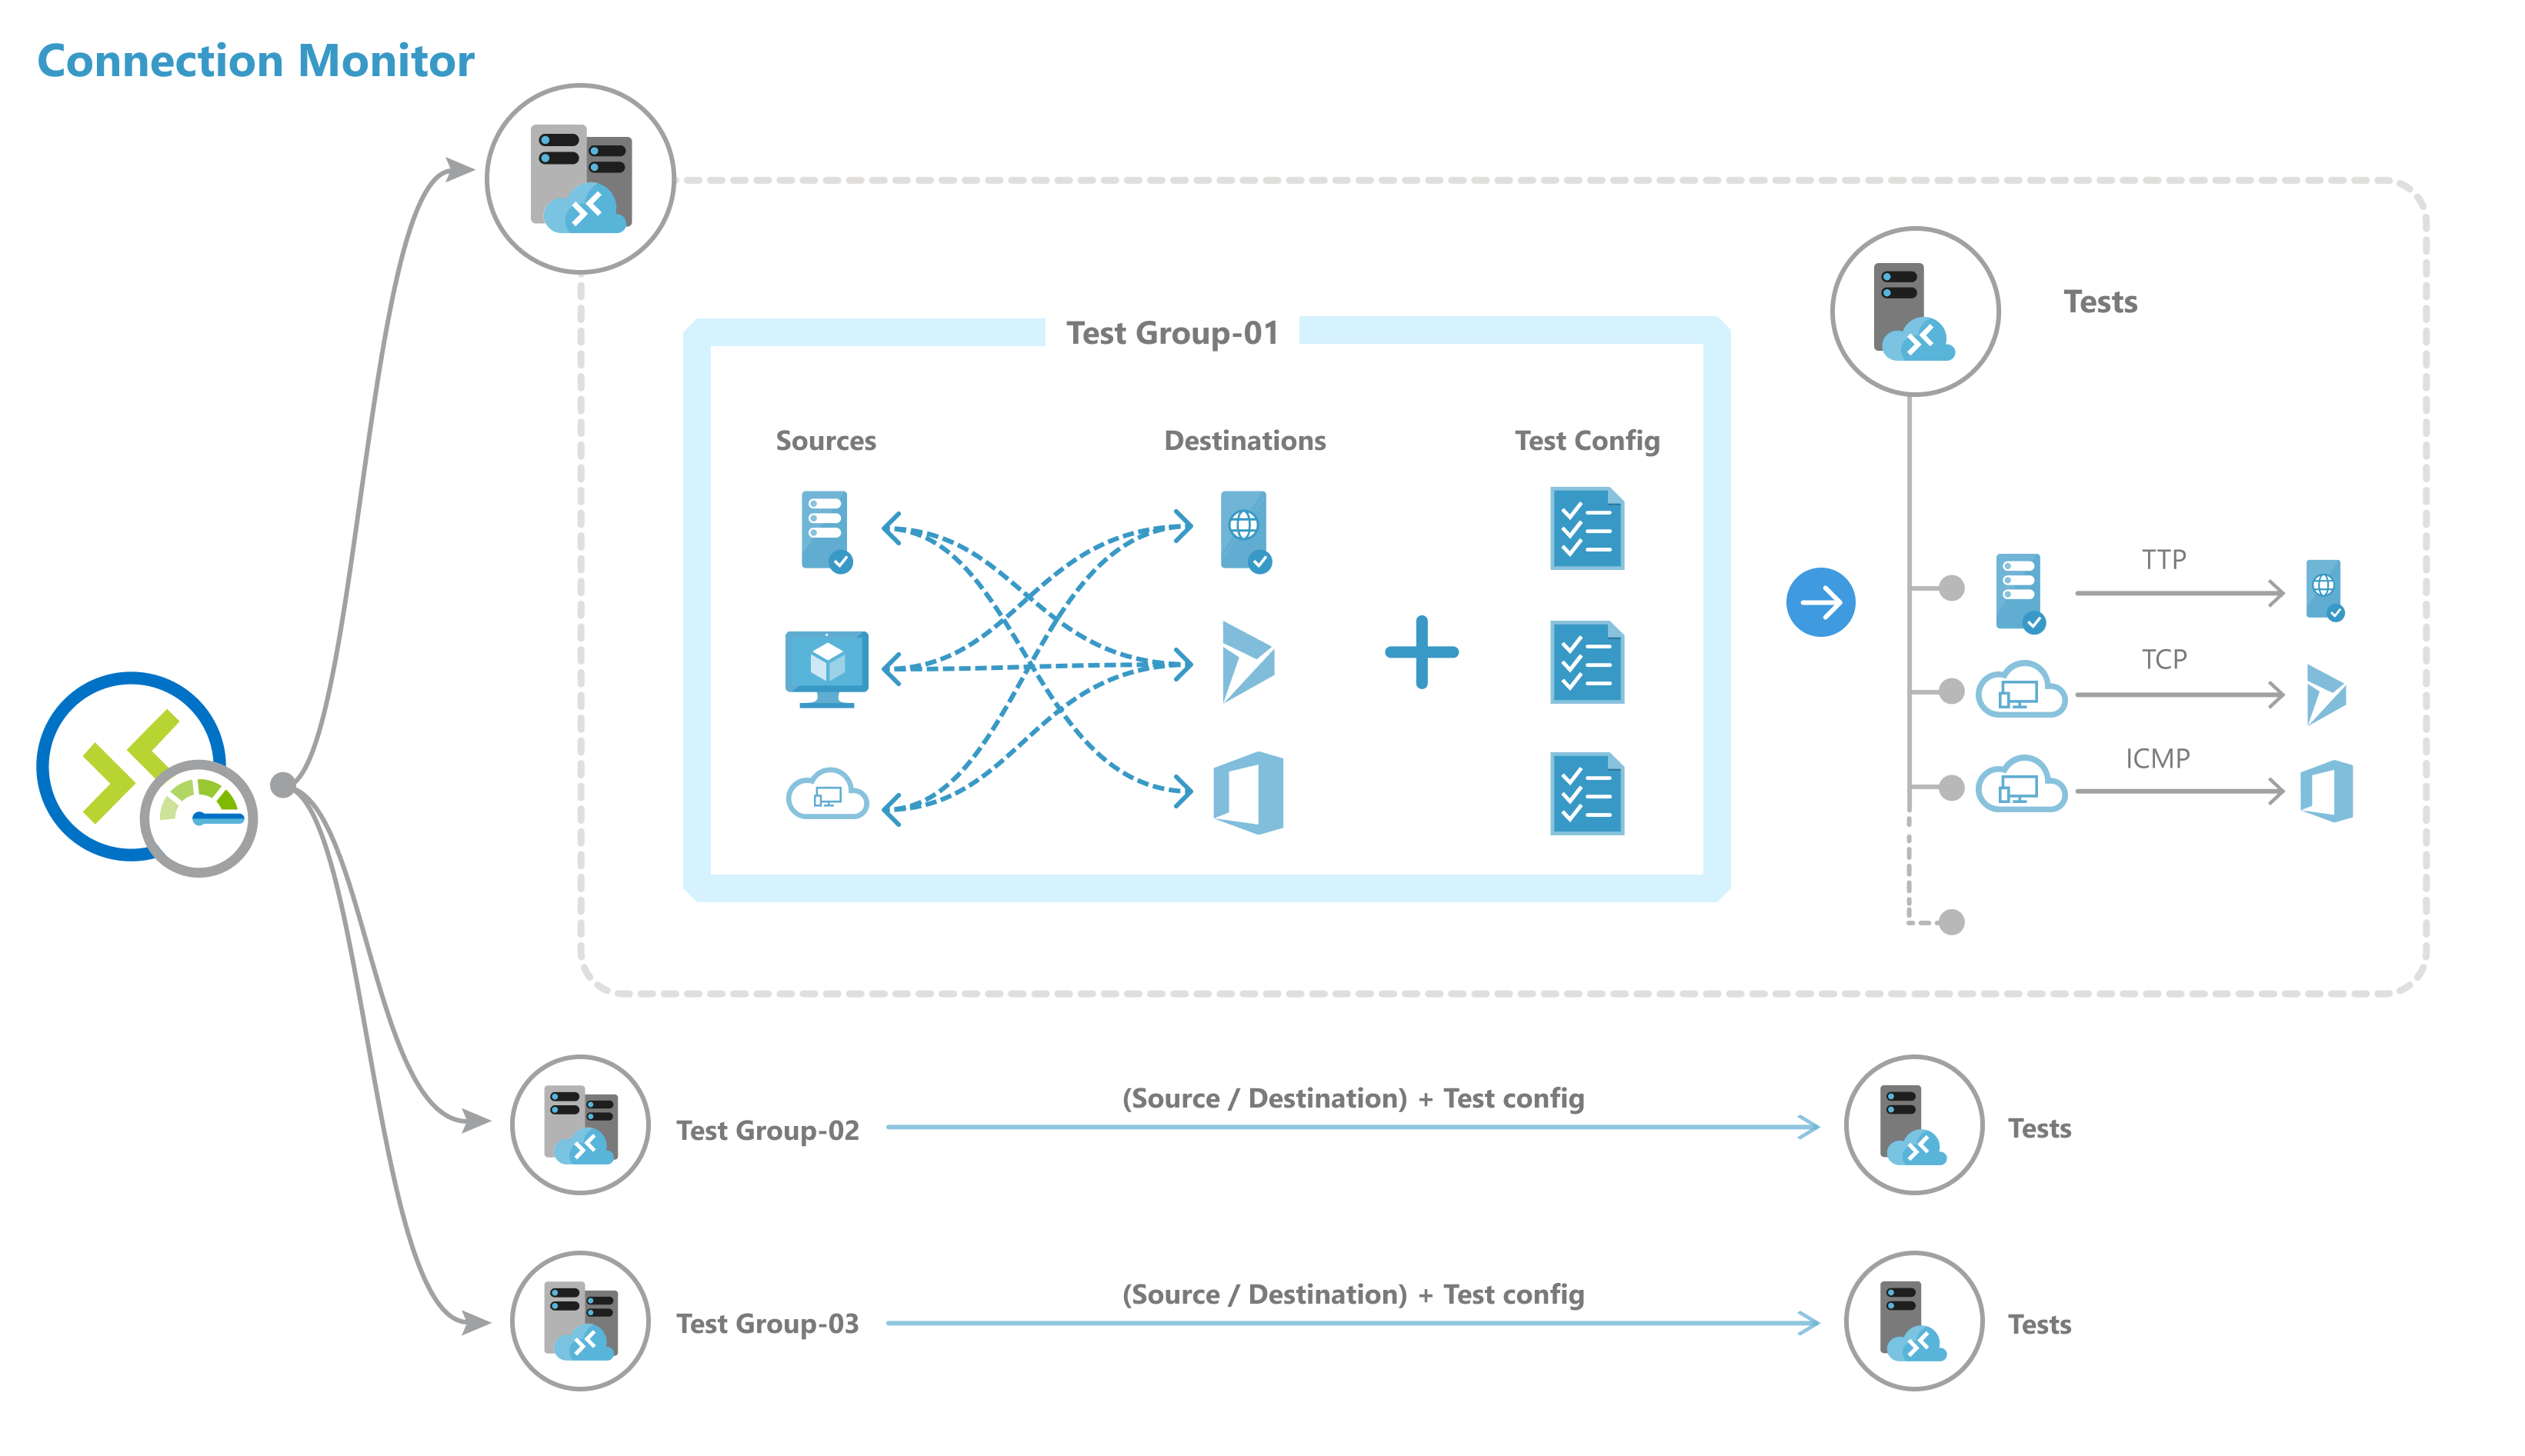
Connection Monitor has these main components.
- Connection monitor resource – A region-specific Azure resource. All of the following entities are properties of a connection monitor resource.
- Endpoint – A source or destination that participates in connectivity checks. Examples of endpoints include Azure VMs, on-premises agents, URLs, and IPs.
- Test configuration – A protocol-specific configuration for a test. Based on the protocol you chose, you can define the port, thresholds, test frequency, and other parameters.
- Test group – The group that contains source endpoints, destination endpoints, and test configurations. A connection monitor can contain more than one test group.
- Test – The combination of a source endpoint, destination endpoint, and test configuration. A test is the most granular level at which monitoring data is available. The monitoring data includes the percentage of checks that failed and the round-trip time (RTT).

Traffic Analytics
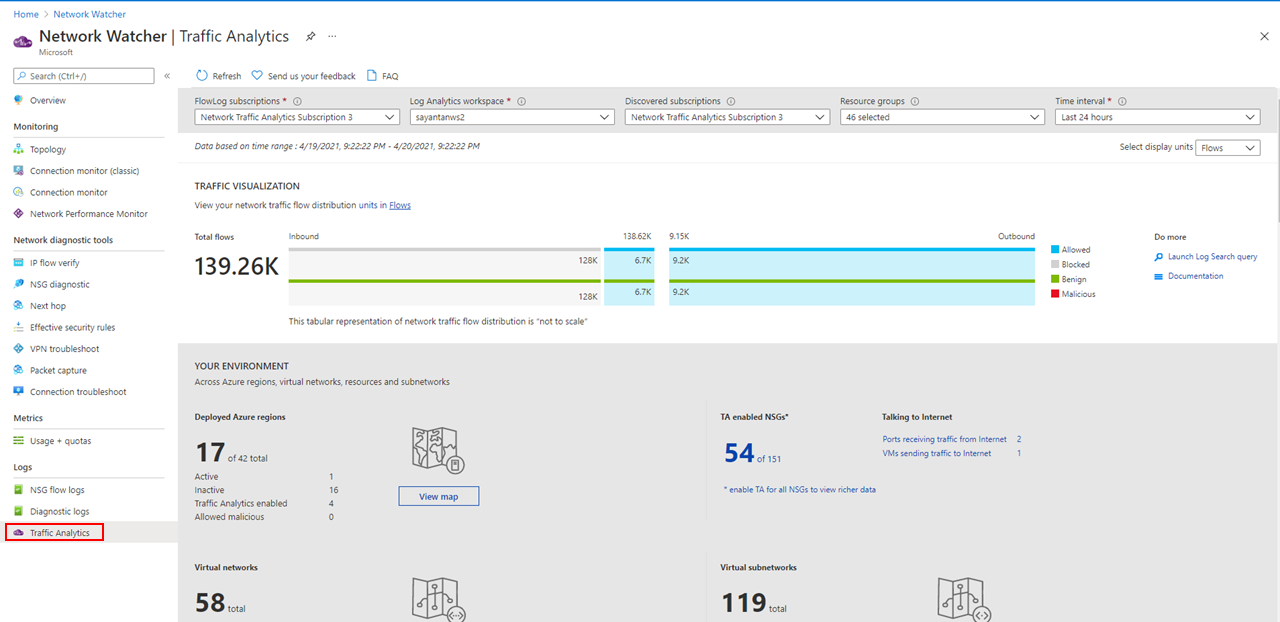
Traffic Analytics is a cloud-based solution that provides visibility into user and application activity in cloud networks. Traffic Analytics analyzes Network Watcher network security group (NSG) flow logs to provide insights into traffic flow in your Azure cloud and provide rich visualizations of data written to NSG flow logs.
With Traffic Analytics, you can:
- Visualize network activity across your Azure subscriptions and identify hot spots.
- Identify security threats to, and secure your network, with information such as open-ports, applications attempting internet access, and virtual machines (VM) connecting to rogue networks.
- Determine traffic flow patterns across Azure regions and the internet.
- Pinpoint network misconfigurations leading to failed connections in your network.
How Traffic Analytics works
Traffic analytics examines the raw NSG flow logs. The raw logs are aggregated and then enhanced. Enhancements include geography, security, and topology information. The information is then stored in a Log Analytics workspace and is available for analysis. The next diagram illustrates the data flow.
This screenshot shows the Traffic Analytics dashboard.

