Debug search issues using the Azure portal
When you first create your search service, you have to make some assumptions about the data you are indexing. You make choices about the index and how to ingest that data. However, until you run your created indexer you can't be certain that you made all the correct choices.
Here, you'll explore how to use the Debug Session tool inside Azure AI Search, look at debugging and then fixing a specific skill, and look at an approach to locally debugging your own custom skills.
Explore how to use the Debug Session tool in Azure AI Search
The Debug Session tool is an interactive visual editor that lets you step through the enrichment pipeline of a document as it's enriched. You can step into each individual skill, make changes and fixes, and then rerun the indexer in real-time. Once you've fixed any issues, you can update and republish the indexer so that it can be rerun to enrich all the documents in your index.
After you've given your debug session a name, and chosen the index you'd like to debug, the search service copies everything it needs to an Azure Storage account. The copy includes the skillset, indexer, source data, and an enriched version of the document that is in the final index.
The session is made up of a skill graph, enriched data source, skill detail pane, execution pane, and an errors/warnings pane.
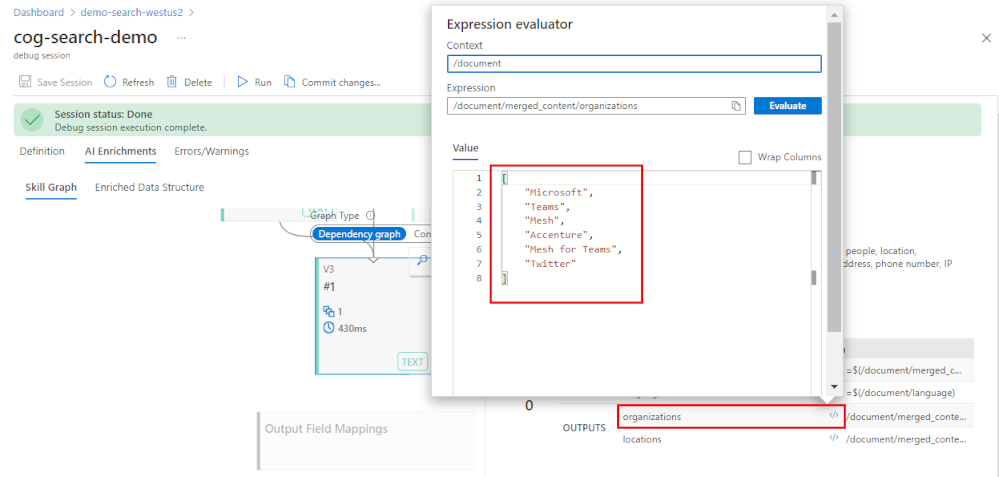
The skill detail pane allows you to expand an expression evaluator to check the value and test the inputs and outputs.
Debug a skillset with Debug Sessions
To create a Debug Session, you navigate to your search service in the Azure portal and carry out these steps:
Create a Debug Session
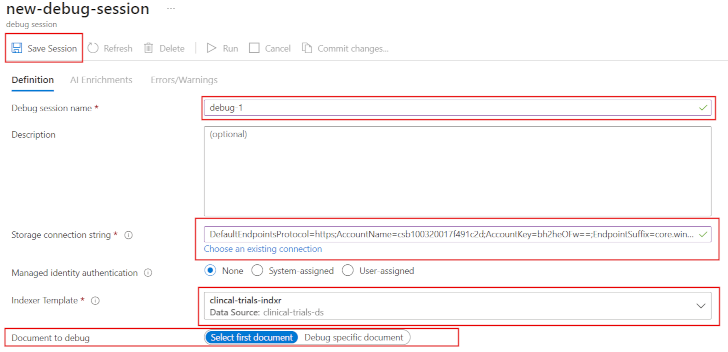
Select Debug Sessions under Search management in the Overview pane.
Select + Add Debug Session.
In Debug session name, provide a name that will help you remember which skillset, indexer, and data source the debug session is about.
In Storage connection string, find a general-purpose storage account for caching the debug session.
In Indexer template, select the indexer that drives the skillset you want to debug. Copies of both the indexer and skillset are used to initialize the session.
In Document to debug, choose the first document in the index or select a specific document.
Select Save Session to get started.
Explore and edit a skill
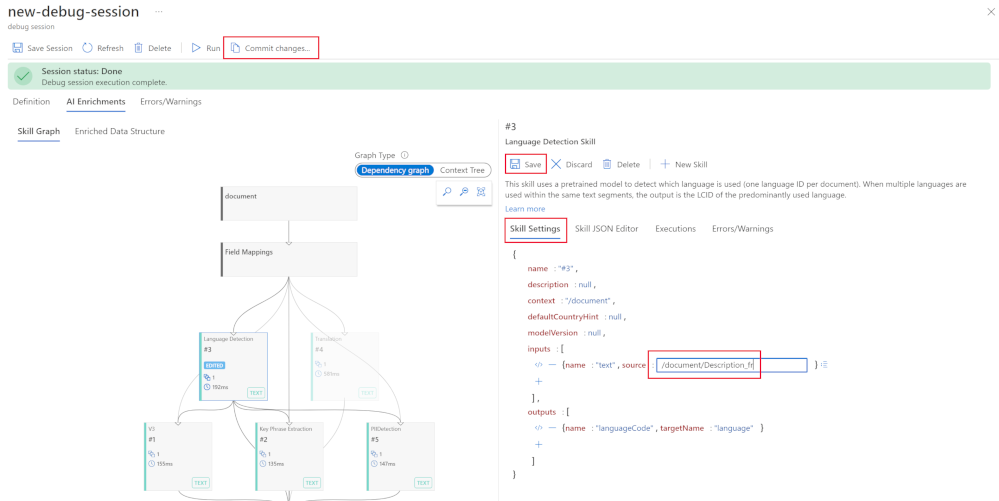
Your Debug Session lets you explore how a document is enriched as it passes through each of the AI skills. You can select a skill, review the inputs and outputs, and even see the JSON definition for the skill.
In the dependency graph, select a skill.
In the details pane to the right, select the Executions tab, then in OUTPUTS, open the Expression evaluator by selecting </> next to organizations .
To edit the skill, select the Skill Settings tab.
Make any changes to the JSON of the skill, then select Save.
To test that the changes have fixed your issue, select Run.
If the issue is now resolved and you want to publish the changes, at the top of the pane select Commit changes....
To finish the debugging session, select Save Session.
Validate the field mappings
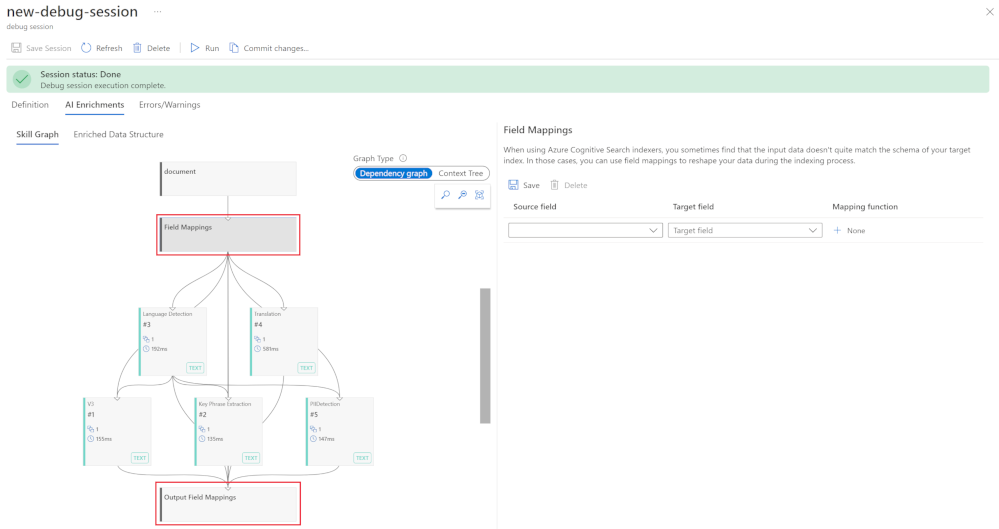
Indexers can be modified if your input data doesn't quite match the schema of your target index. Use field mappings to reshape and fix this mismatch in your data during the indexing process.
Select Skill Graph, and check that Dependency graph is selected.
Select the second step in the enrichment pipeline, Field Mappings.
Make any changes to where data should be mapped to.
Select Save.
Select the last step, Output Field Mappings.
Output field mappings from the skills can be fixed in the detail pane.
Select Save.
To test that the changes have fixed your issue, select Run.
If the issue is now resolved and you want to publish the changes, at the top of the pane select Commit changes....


