Introduction
In the private mobile networks powered with Azure Private 5G Core, enterprises usually run mission-critical applications that support their user equipment (UE). For example, robots on a factory floor rely on the network to communicate with each other. IoT devices in a smart farm rely on the network to report status and adjust to environmental changes. If these UEs malfunction or even stop functioning due to network connectivity or performance issues, the business of the enterprise is severely impacted. Therefore, monitoring the health and performance of the network continuously and making sure everything runs smoothly are of critical importance to the business continuity of enterprises. In addition, to minimize business impact, enterprises need to quickly diagnose and fix any issues that are reported.
In this module, we introduce the use of the network monitoring and issue diagnosis tools that Azure Private 5G Core offers. After learning about them, you should be able to choose the appropriate tools based on the business needs of an enterprise, and use your chosen tools to do the monitoring and issue diagnosis.
Monitoring and troubleshooting capabilities
Azure Private 5G Core provides flexible monitoring options. It allows you to either monitor multiple sites in a private mobile network centrally from the cloud or monitor each individual site locally.
Cloud monitoring
Cloud monitoring using platform metrics
The Mobile Network Site resource that you use to manage a site in your private mobile network contains a list of dashboards called platform metrics. Through the platform metrics, you can check site health and performance information such as user plane packets dropped or session establishment failures.
Cloud monitoring using the Azure Monitor REST API
Azure Private 5G Core shares network health metrics through Azure Monitor. You can use the Azure Monitor REST API to retrieve the metrics and then integrate the metrics data into an application of your choice. Additionally, you can export the metrics data to a data storage and processing service such as Azure Monitor Log Analytics, Azure Storage, or Azure Event Hubs and use the data from there.
Local monitoring
The packet core instance that powers each site in a private mobile network provides packet core dashboards. With these dashboards, you can monitor key network statistics in real time. These dashboards also allow you to view information on firing alerts, based on which you can quickly react to emerging issues.
For diagnosing issues that are reported during network monitoring, Azure Private 5G Core provides a distributed tracing tool for each packet core instance. This tool allows you to analyze the communication between network functions and identify the root cause of a certain issue. Once the root cause is identified, you can take relevant measures to fix the issue.
With these monitoring and troubleshooting tools, you can monitor the health and performance of your private mobile network on a continuous basis. Then, diagnose the issues that are reported. The monitoring and troubleshooting capabilities of Azure Private 5G Core help ensure the business continuity of enterprises and minimize possible business impact.
Video: Monitor Azure Private 5G Core
The following video provides details on monitoring Azure Private 5G Core:
Monitoring example
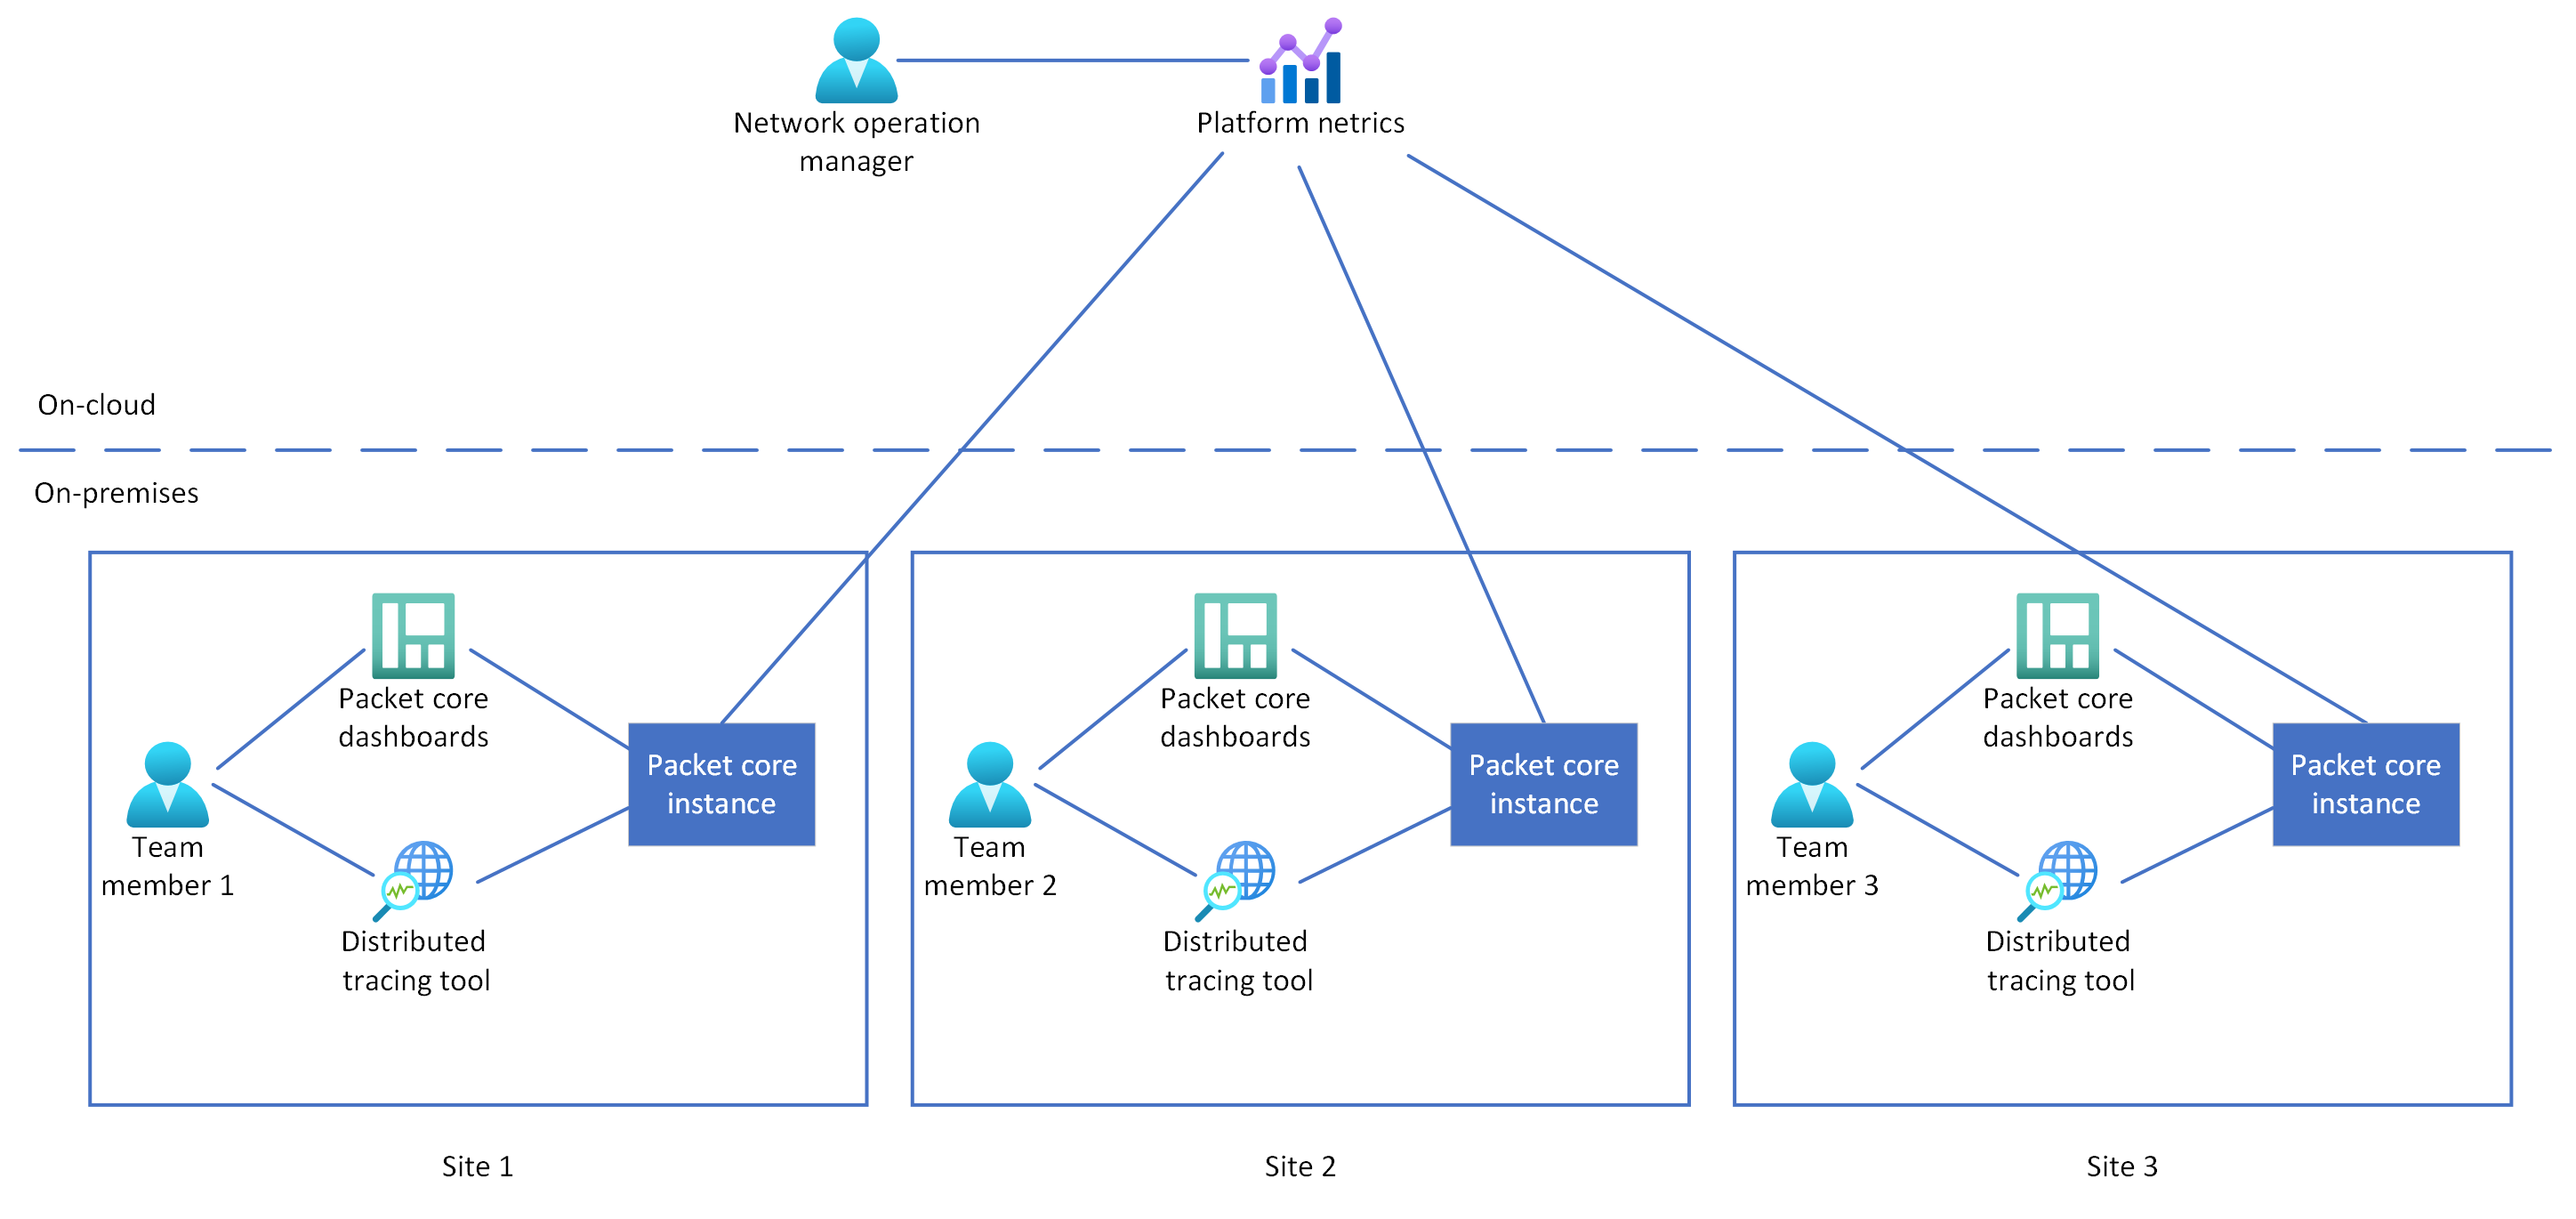
Suppose you're a network operation manager in a logistics company, which has three sites deployed with Azure Private 5G Core in its private mobile network. You have a team member working at each site. One of the major responsibilities of your team is to monitor the entire mobile network and make sure everything runs smoothly. If an issue is reported during the monitoring, your team diagnoses the issue, and then takes measures to fix it.
In this case, you can choose to use the platform metrics to monitor the sites remotely through the Azure portal. This way, you can monitor the health of the network no matter where you work. For the team members at different sites, you can ask them to use the packet core dashboards to monitor the site locally in real time. If the monitoring tool reports an issue for a site, the team member at the site can use the distributed tracing tool to diagnose the issue.
The following diagram illustrates this monitoring structure:

Tip
Based on the business needs of the logistics company, you might need to choose other monitoring tools. For example, the company might want to use a third-party application to do the monitoring. In that case, consider using the Azure Monitor REST API to do application integration.
Monitoring configuration
Different enterprises have different business needs and therefore different monitoring requirements. For example, in a private mobile network for military use, issues have to be identified within seconds and resolved quickly.
To satisfy the specific monitoring requirements of an enterprise, you need to configure the monitoring appropriately. The major configuration includes alert levels and monitoring metrics.
Different tools might define different alert levels. For example, in the packet core dashboards, you might see critical, major, or minor alerts. Among these alerts, the critical alerts have the highest priority and should be handled first.
The following screenshot shows an example packet core Alert dashboard with five critical alerts:

Based on the business needs of an enterprise, you should also define a set of key metrics to monitor.
In general, pay special attention to the following metrics:
- Data plane metrics
- The numbers of packets sent/received on the N3/N6 interfaces
- The number of bytes sent/received on the N3/N6 interfaces
- The distribution of packet sizes on the N3/N6 interfaces
- Subscriber metrics
- Registration status
- Connection status
- Data throughput