Using Failed Request Tracing rules to troubleshoot Application Request Routing
Applies to: Internet Information Services on Windows Server 2016 and later operating system versions
Failed Request Tracing is a powerful tool for troubleshooting request-processing failures in the Internet Information Services (IIS) web server that ships with Windows Server 2016 or later versions. This article provides steps to enable Failed Request Tracing rules to debug failures and trace steps in Application Request Routing. For more information about Failed Request Tracing rules, see Troubleshoot failed requests using tracing in IIS.
Goal
To configure Failed Request Tracing rules and to understand what to look for when troubleshooting Application Request Routing.
Prerequisites
This walkthrough requires the following prerequisites:
- IIS on Windows Sever 2016 (any SKU) or newer with Tracing role service installed for IIS.
- Microsoft Application Request Routing and dependent modules.
- Minimum of two application servers with working sites and applications.
If Application Request Routing hasn't been installed, download it from the Download Center, and install it by following the steps outlined in Install Application Request Routing.
Another prerequisite is that you have gone through Using the Application Request Routing Module and have configured Application Request Routing. Application Request Routing should be in working order before proceeding with the following sections.
Step 1: Configure Failed Request Tracing rules
Configure the Failed Request Tracing rules for Application Request Routing using the UI or using the command-line.
How to configure Failed Request Tracing rules using the UI
Launch Internet Information Services (IIS) Manager (inetmgr).
Select Default Web Site.
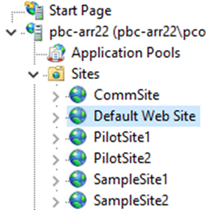
In the Actions pane, under Configure, select Failed Request Tracing….

In the Edit Web Site Failed Request Tracing Settings dialog box, select the Enable checkbox.
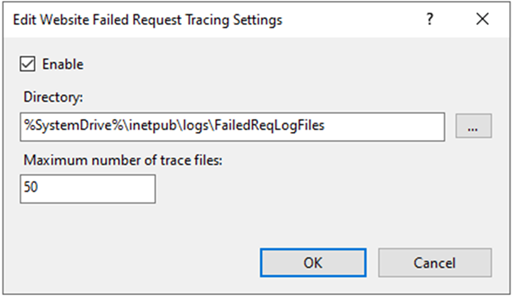
Select OK to save changes.
Select Default Web Site.
Double-click Failed Request Tracing Rules.
In the Actions pane, select Add….
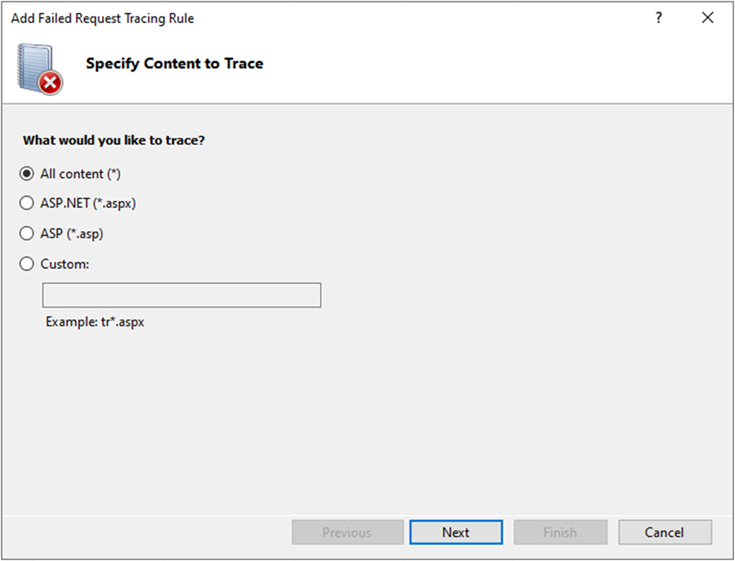
Select All content (*), and then select Next.
Select Status code(s): and enter 200-399.
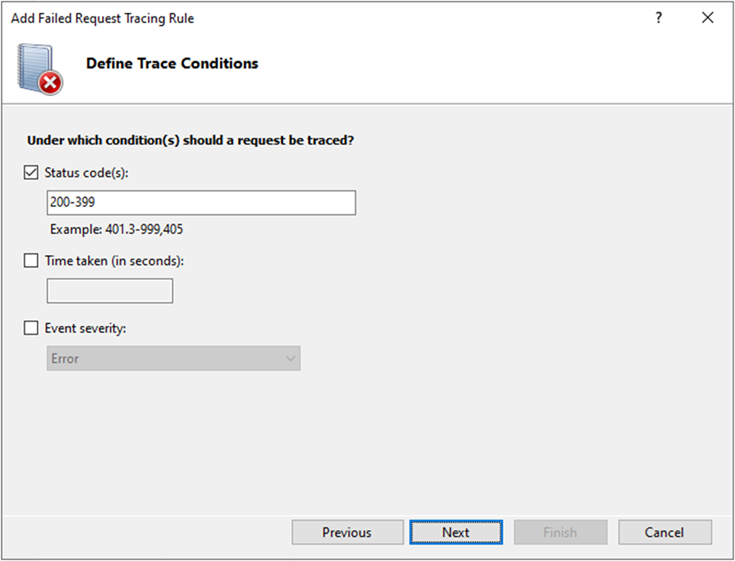
Select Next. The above configuration has created a Failed Request Tracing rule that writes traces when the status code falls between 200 and 399.
Deselect ASP,ASPNET, and ISAPI Extension. After selecting WWW Server, deselect everything under Areas:, except for Rewrite and RequestRouting. Because Application Request Routing relies on the URL Rewrite Module to inspect incoming requests, it's recommended that you enable the traces for both Application Request Routing (RequestRouting) and URL Rewrite Module (Rewrite).
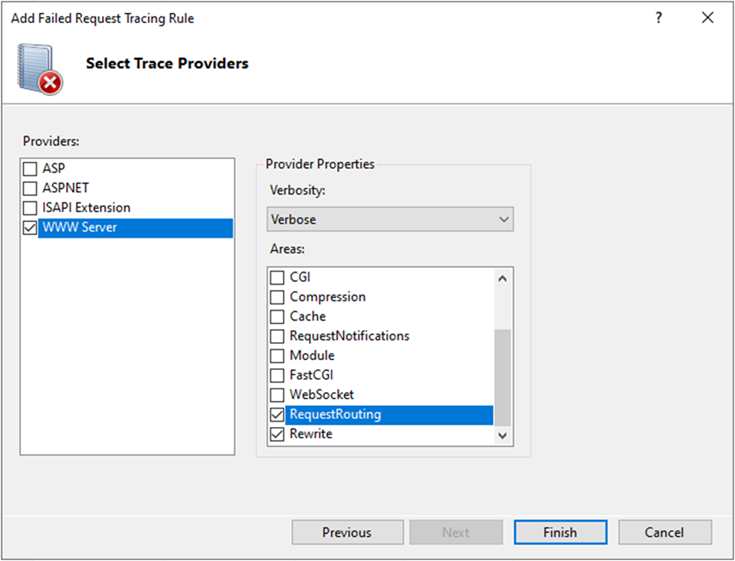
For additional information about URL Rewrite Module traces, see Using Failed Request Tracing to Trace Rewrite Rules.
Select Finish.
How to configure Failed Request Tracing rules using the command-line
Open a command prompt with administrator privileges.
Navigate to
%windir%\system32\inetsrv.To enable Failed Request Tracing on the Default Web Site, run the following command:
appcmd set site "Default Web Site" -traceFailedRequestsLogging.enabled:"true" /commit:apphostTo configure the Failed Request Tracing Rules as shown in the UI above, run the following commands:
appcmd.exe set config "Default Web Site" -section:system.webServer/tracing/traceFailedRequests /+"[path='*']"appcmd.exe set config "Default Web Site" -section:system.webServer/tracing/traceFailedRequests /+"[path='*'].traceAreas.[provider='WWW Server',areas='Rewrite,RequestRouting',verbosity='Verbose']"appcmd.exe set config "Default Web Site" -section:system.webServer/tracing/traceFailedRequests /[path='*'].failureDefinitions.statusCodes:"200-399"
Step 2: Analyze Failed Request Tracing Logs
In this step, you'll send requests to Application Request Routing and analyze Failed Request Tracing logs.
To view Failed Request Tracing logs
Navigate to the directory where the Failed Request Tracing logs are written. By default, the location is
%SystemDrive%\inetpub\Logs\FailedReqLogFiles\.Change the directory to the folder that matches the Default Web Site. By default, it's W3SVC1. If you're unsure, select the Default Web Site in IIS Manager, and then select Advanced Settings… in the Actions pane. The value of the ID indicates the corresponding folder. (For example, ID 1 corresponds to W3SVC1).
If there are any XML files, remove them by typing:
del *.xmlSend a request to Application Request Routing. If Application Request Routing is functioning correctly, it results in a 200 response, which falls within the 200 to 399 range that is specified in Step 1. Therefore, the logs are written to the location above.
List the files in the directory to confirm that new XML files are written.
Open the XML file. Select Request Details. Select Complete Request Trace, and then Select Expand All. The following image is an example of a Failed Request Tracing log for Application Request Routing:
Pay closer attention to the following sections:
GENERAL_REQUEST_HEADERS:
- Headers: Shows the HTTP header that Application Request Routing has received.
ARR_REQUEST_ROUTED:
- WebFarm: Indicates the name of the server group where the request is routed.
- Server: Indicates the destination server where the request is routed.
- Algorithm: Indicates which load balance algorithm is used.
- RoutingReason: Indicates the decision behind why the server is selected.
ARR_SERVER_STATS:
- State: Availability of the destination server.
- TotalRequests: Runtime statistic on how many requests have been sent to this server.
- CurrentRequests: Runtime statistic on the concurrent number of HTTP requests to this server.
- BytesSent: Runtime statistic on how much data in KB have been sent to this server.
- BytesReceived: Runtime statistic on how much data in KB have been received from this server.
- ResponseTime: Runtime statistic on the responsiveness in ms of this server.
GENERAL_RESPONSE_HEADERS
- Headers: Shows the response HTTP header from the destination server.
GENERAL_RESPONSE_ENTITY_BUFFER
- Buffer: Shows the response entity from the destination server.
The following have been added with the timestamps to indicate the start and end times of corresponding events to profile the performance of Application Request Routing:
- ARR_REQUEST_HEADERS_START
- ARR_REQUEST_HEADERS_END
- ARR_RESPONSE_HEADERS_START
- ARR_RESPONSE_HEADERS_END
- ARR_RESPONSE_ENTITY_START
- ARR_RESPONSE_ENTITY_END
- ARR_RESPONSE_ENTITY_START
- ARR_RESPONSE_ENTITY_END
If you're collecting the Failed Request Tracing logs on server core, copy the logs with freb.xsl stylesheet to a computer where a browser is available.
Summary
You have now successfully configured Failed Request Tracing rules for Application Request Routing. Failed Request Tracing rules can be used to troubleshoot and debug Application Request Routing, as well as understand the routing decisions, including load balance algorithms, that it has made in selecting the destination server for a given request.
