Preventing Memory Leaks in Windows Applications
Affected Platforms
Clients - Windows 7
Servers - Windows Server 2008 R2
Description
Memory leaks are a class of bugs where the application fails to release memory when no longer needed. Over time, memory leaks affect the performance of both the particular application as well as the operating system. A large leak might result in unacceptable response times due to excessive paging. Eventually the application as well as other parts of the operating system will experience failures.
Windows will free all memory allocated by the application on process termination, so short-running applications will not affect overall system performance significantly. However, leaks in long-running processes like services or even Explorer plug-ins can greatly impact system reliability and might force the user to reboot Windows in order to make the system usable again.
Applications can allocate memory on their behalf by multiple means. Each type of allocation can result in a leak if not freed after use. Here are some examples of common allocation patterns:
- Heap memory via the HeapAlloc function or its C/C++ runtime equivalents malloc or new
- Direct allocations from the operating system via the VirtualAlloc function.
- Kernel handles created via Kernel32 APIs such as CreateFile, CreateEvent, or CreateThread, hold kernel memory on behalf of the application
- GDI and USER handles created via User32 and Gdi32 APIs (by default, each process has a quota of 10,000 handles)
Best Practices
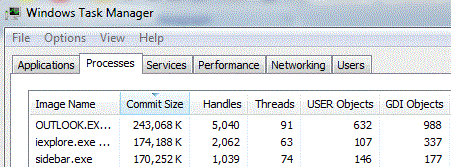
Monitoring the resource consumption of your application over time is the first step in detecting and diagnosing memory leaks. Use Windows Task Manager and add the following columns: "Commit Size", "Handles", "User Objects", and "GDI Objects". This will allow you to establish a baseline for your application and monitor resource usage over time.

The following Microsoft tools provide more-detailed information and can help to detect and diagnose leaks for the various allocation types in your application:
- Performance Monitor and Resource Monitor are part of Windows 7 and can monitor and graph resource use over time
- The latest version of Application Verifier can diagnose heap leaks on Windows 7
- UMDH, which is part of the Debugging Tools for Windows, analyzes the heap memory allocations for a given process and can help find leaks and other unusual usage patterns
- Xperf is a sophisticated performance analysis tool with support for heap allocation traces
- CRT Debug Heap tracks heap allocations and can help build your own heap debugging features
Certain coding and design practices can limit the number of leaks in your code.
- Use smart pointers in C++ code both for heap allocations as well as for Win32 resources like kernel HANDLEs. The C++ Standard library provides the auto_ptr class for heap allocations. For other allocation types you will need to write your own classes. The ATL library provides a rich set of classes for automatic resource management for both heap objects and kernel handles
- Use compiler intrinsic features like _com_ptr_t to encapsulate your COM interface pointers into "smart pointers" and assist with reference counting. There are similar classes for other COM data types: _bstr_t and _variant_t
- Monitor your .NET code unusual memory usage. Managed code is not immune to memory leaks. See "Tracking down managed memory leaks" on how to find GC leaks
- Be aware of leak patterns in web client-side code. Circular references between COM objects and scripting engines like JScript can cause large leaks in web applications. "Understanding and Solving Internet Explorer Leak Patterns" has more information on these kinds of leaks. You can use the JavaScript Memory Leak Detector to debug memory leaks in your code. While Windows Internet Explorer 8, which is shipping with Windows 7, mitigates most of these issues, older browsers are still vulnerable to these bugs
- Avoid using multiple exit paths from a function. Allocations assigned to variables at function scope should be freed in one particular block at the end of the function
- Do not use exceptions in your code without freeing all local variables in functions. If you use native exceptions, free all your allocations inside the __finally block. If you use C++ exceptions, all your heap and handle allocations need to be wrapped in smart pointers
- Do not discard or reinitialize a PROPVARIANT object without calling the PropVariantClear function
Links to Resources
Common Allocation Patterns:
- Heap Allocation Function
- Memory Allocation Function
- New Operator (C++)
- Virtual Allocation Function
- Kernel Objects
- GDI Object Handles
- User Interface Object Handles
Microsoft Tools:
- Application Verifier
- Debugging Tools for Windows
- User-Mode Dump Heap
- Trace Capture, Processing, and Analysis Tool
- CRT Debug Heap
Additional Links:
- auto_ptr Class
- Active Template Library (ATL) Memory Classes
- _com_ptr_t Object
- _bstr_t Class
- _variant_yt Class
- "Tracking down managed memory leaks"
- "Understanding and Solving Internet Explorer Leak Patterns"
- "JavaScript Memory Leak Detector"
- Circular Memory Leak Mitigation (in browsers):
- try-finally statement
- PROPVARIANT Structure
- PropVariantClear Function