A painless introduction to PIX for Windows
For those interested in game development technology, it’s been a great week of product releases! Monday we saw the 1.0 release of XNA Game Studio Express. Wednesday brought the release of the December 2006 version of the DirectX SDK, which includes the product I work on, PIX for Windows. Friday, Visual Studio 2005 SP1 was released. Congratulations to everyone involved with these products!
I thought I'd write a short introductory article on using PIX for Windows. PIX can be used in many different ways to analyze, debug, optimize, and test programs that use Direct3D, and it has a lot of features -- so it might be a bit intimidating at first. The basic usage pattern is pretty straightforward, though, so if you haven't ever used PIX before, maybe this walkthrough will encourage you to give it a try. Whether you write programs using native Direct3D, managed DirectX, or XNA, PIX can show you a lot of useful information about what your program is doing and how you can make it work better.
I recommend that you download the December 2006 DXSDK (and newer versions as they are released), since PIX gains new features and improvements with each release.
Once you have the DXSDK installed on your computer, you'll find PIX under the Start menu at:
Start
--> Microsoft DirectX SDK (December 2006)
--> DirectX Utilities
--> PIX for Windows
The first thing you need to do in PIX is to create an experiment (use File --> New Experiment). An experiment tells PIX how to run your program (called the target program) and what to do while target program is running. You can create complex experiments to do all sorts of fancy things, but probably 90% of the time you simply want to do something like the following:
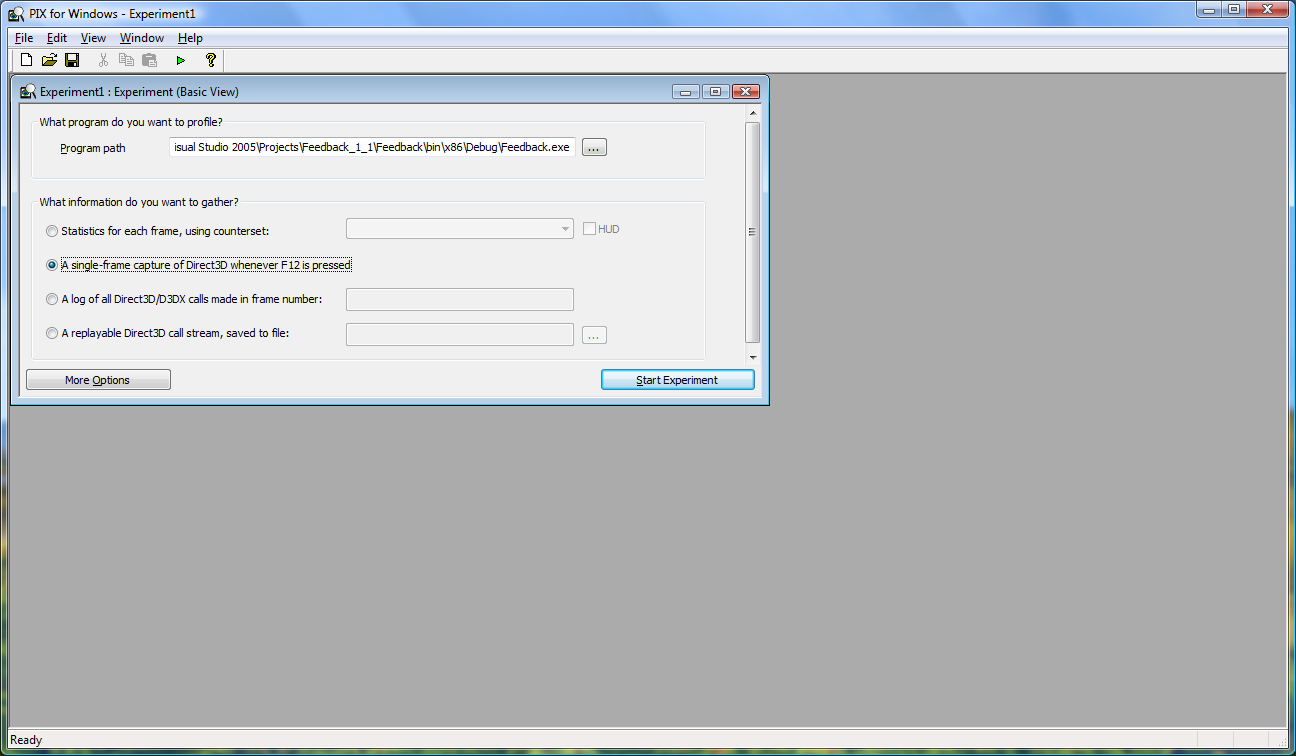
Note that I've set the "Program path" to the executable for my Feedback XNA program, and chosen to gather "A single-frame capture of Direct3D whenever F12 is pressed."
That wasn't too hard to set up...let's see what happens! Click "Start Experiment" to launch the target program under PIX.
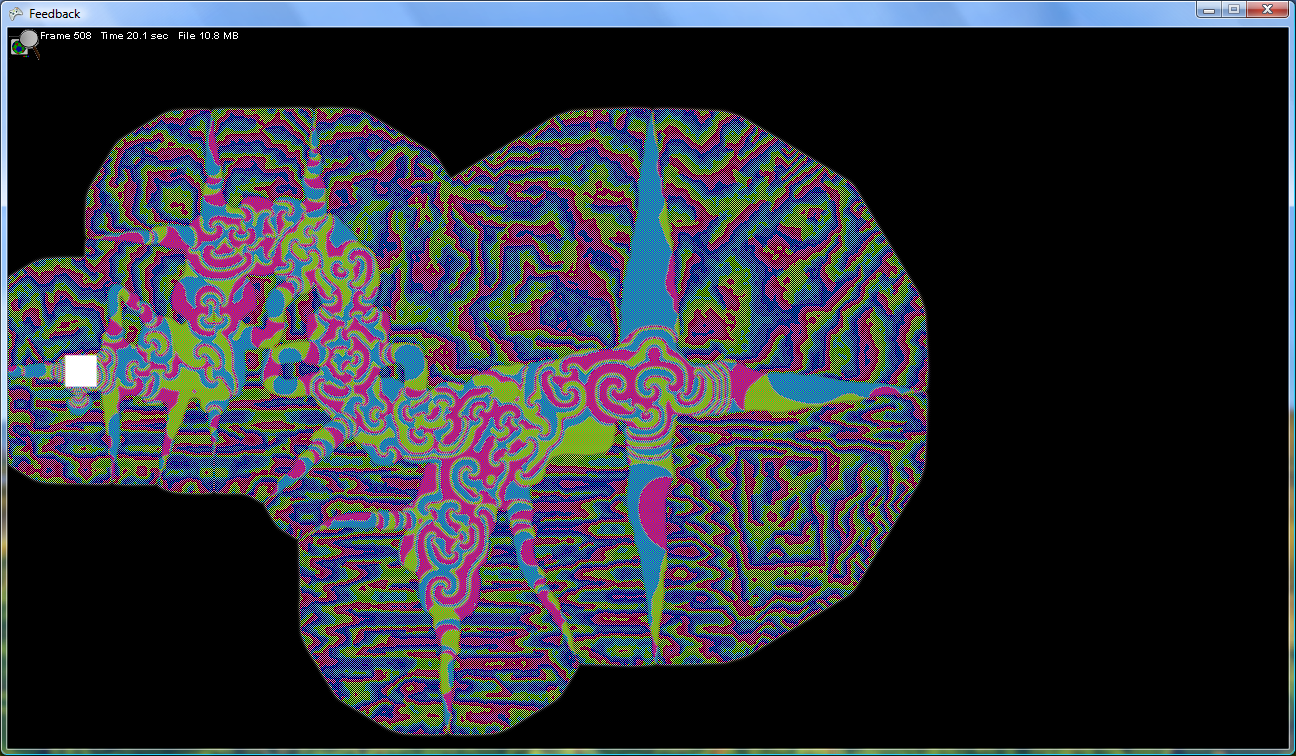
PIX overlays some information on top of the target program while it runs. When you press F12, you should see the File size jump from zero to a few megabytes (the size varies depending on the program). This lets you know that the capture took place, and you should close your program at this point. PIX responds by bringing up a run file representing the data that it gathered.

The run file window is divided into several panes that show different kinds of information. You can drag the separators between the panes to show the most information on the panes that you currently are interested in. Note that in the Window menu, you can choose "Save as Custom Pane Layout" to have PIX automatically use your pane layout every time you open a run file. For now, we're not interested in the Timeline pane, since it is usually not very helpful for single-frame captures, so use the separators to divide the screen space between the remaining panes.
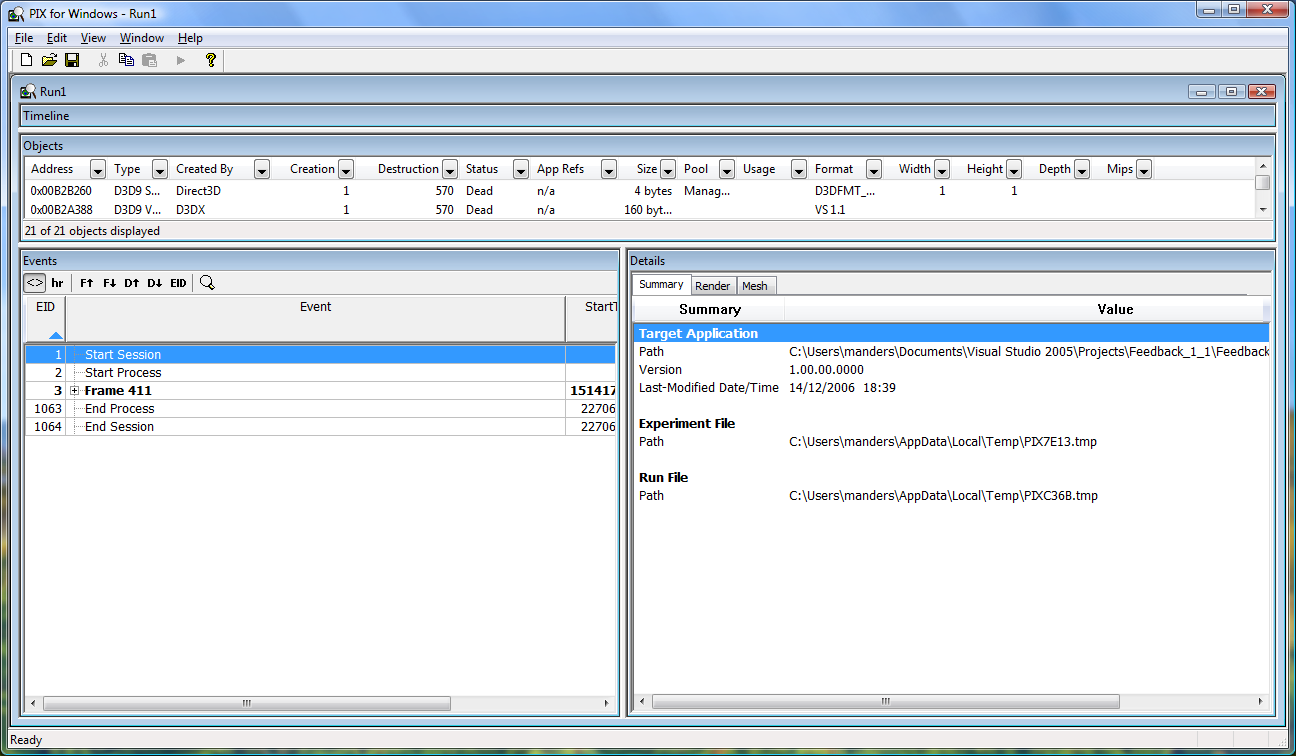
The Events pane shows one row for each event in the capture, including one event for each Direct3D call. You can use the "+" icon to expand events that contain other events. For now, click the Frame event to select it. Now click the Render tab in the Details pane, and you should see the result of rendering that frame.
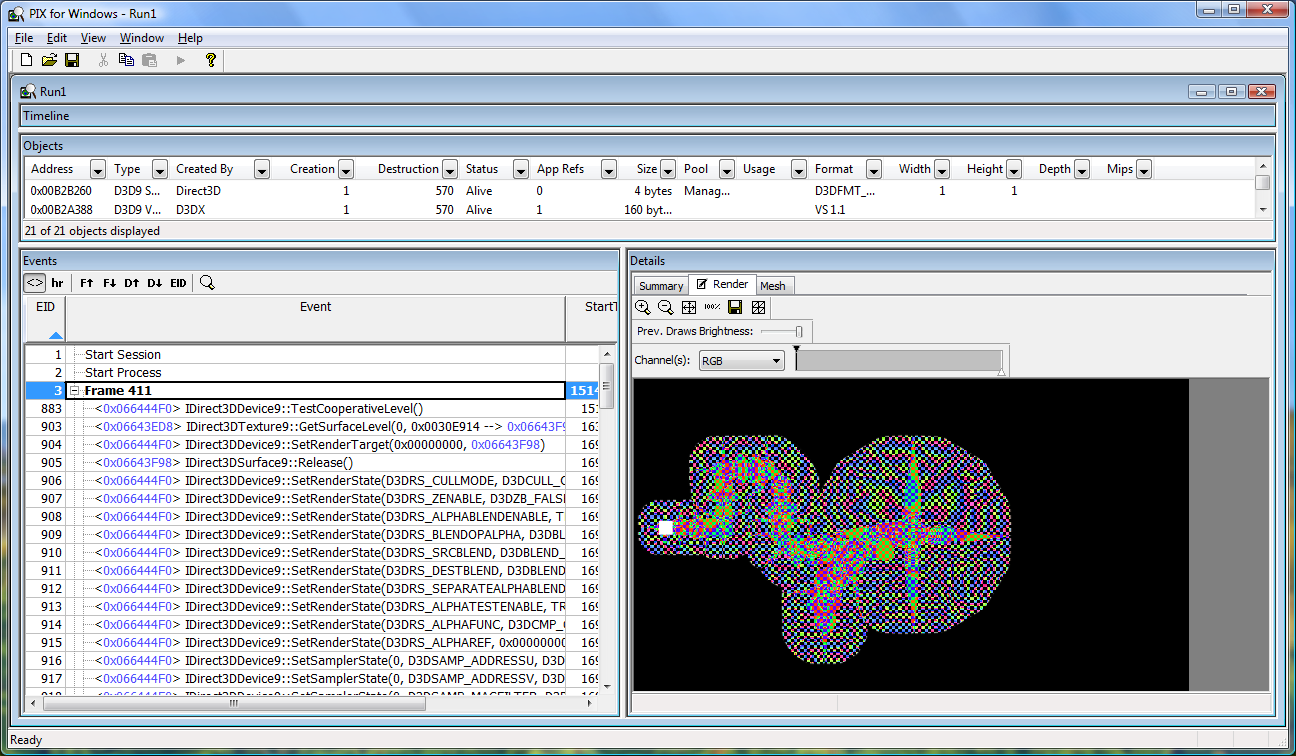
The Render tab always shows the contents of the back buffer as of the currently-selected event. So you can watch your frame render bit by bit, by selecting each Draw call. The "D down" toolbar button makes this easier; it moves to the next Draw call. (But see below for a note about programs that change the render target).
When a Draw call is selected, the Mesh tab shows useful information about the vertex data that was processed by the graphics pipeline. You can see the data both before and after going through the vertex shader, and see where it ended up relative to the viewport.

Note that several object pointers are shown in blue text. This indicates that PIX can show more information about the objects. For most object types, you can right-click a blue pointer and choose to view the object. This brings up a new tab in the Details pane that shows the object contents. Viewing the Direct3D Device object lets you see all the settings for the device, including all the render state and bound objects such as vertex buffers, index buffers, and textures.
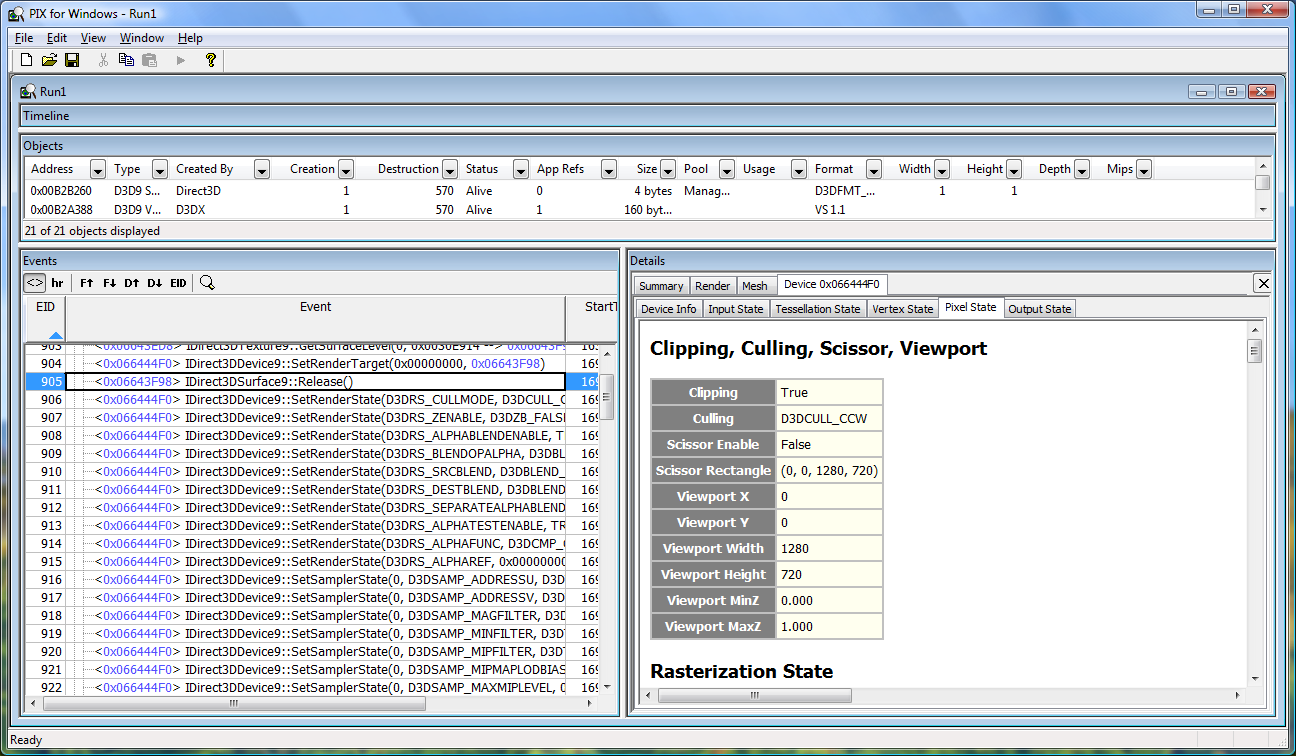
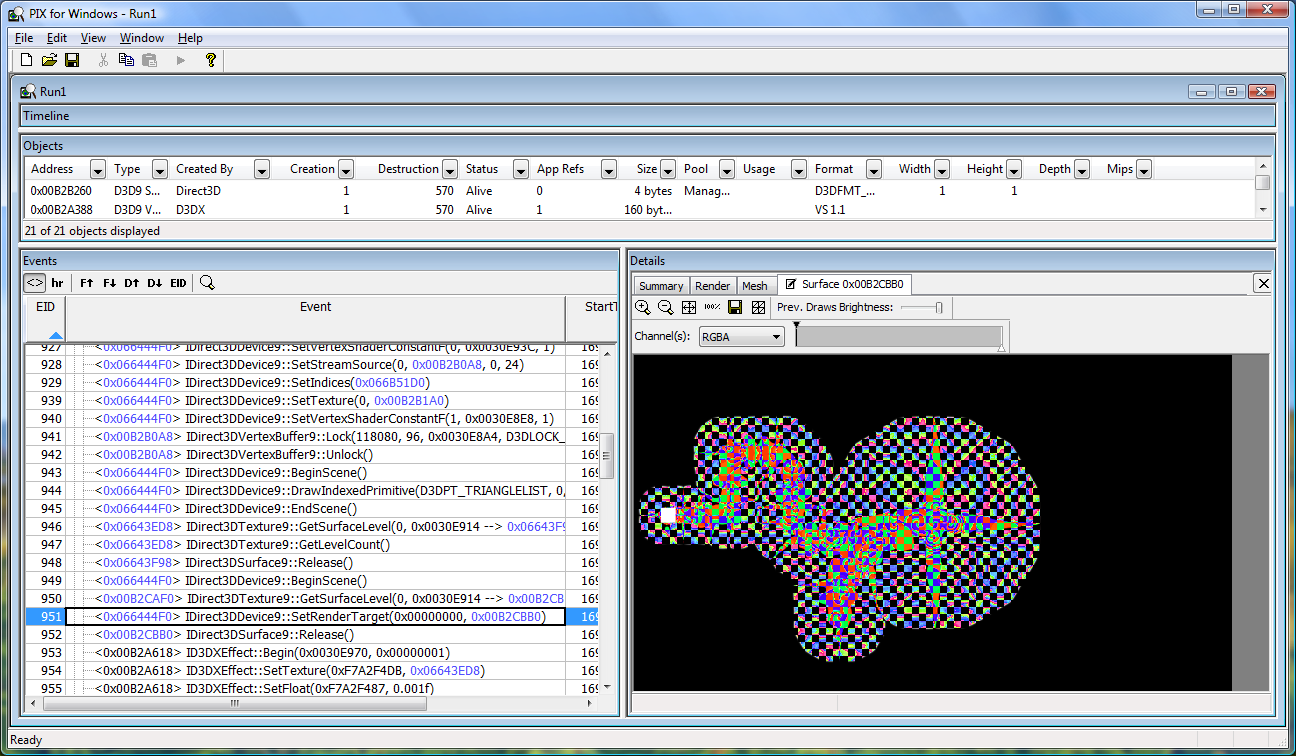
If your program uses multiple render targets (as the Feedback program does), you should keep in mind that the Render tab shows the contents of the back buffer, not the current render target. So you should find the SetRenderTarget call and bring up a view of the render target to see the drawing happen on that surface. The tab for the current render target has a little icon next to it.
I hope this gives you a sense of how PIX can help you examine your program’s usage of Direct3D. Give PIX a try and see if it gives you ideas on how to make your program run better! I’ll give more examples of using PIX in future posts.
-Mike
Comments
Anonymous
January 15, 2007
While I've been busy working on our broader community plans, Mike Anderson (Manders vs. Machine)Anonymous
April 08, 2008
I haven't written anything about PIX in a while . But here's a great article written by Brian Richardson