Remote GPU Debugging on Nvidia Hardware
The GPU debugger in Visual Studio 2012 (VS2012) can be extended by hardware vendors to debug directly on GPU hardware rather than on a software emulator. Nvidia has built such an extension and has made it publicly available as part of Nsight 3.0 (Nsight Visual Studio Edition 3.0 Release Candidate 1 is available here. It requires you to first register and login to the Nsight Visual Studio Edition Registered Developer Program here).
Once you have downloaded the Nsight 3.0 installer, you can follow the instructions below to begin debugging using Nvidia’s GPUs. Debugging on Nvidia hardware requires two machines: one local machine to run Visual Studio and one remote machine (running Windows 7 or Windows 8) with an Nvidia (Fermi or Kepler) GPU to use as a debugging target.
For debugging purposes, because of current limitations in the driver, the remote machine must be configured with only one GPU card enabled.
Local Installation
1. Run the Nsight 3.0 installer on a local machine with an existing VS2012 installation. Once you have accepted the license terms you will be presented with a feature installation summary that looks something like this.
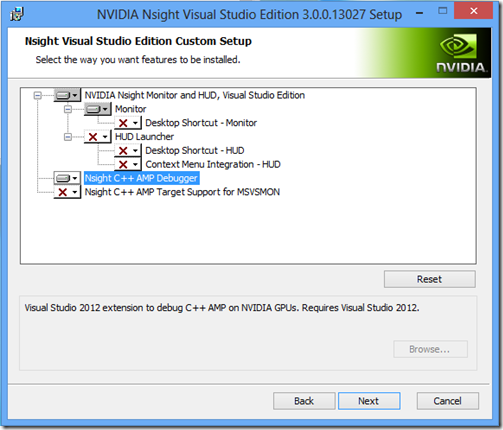
2. Select “Customize” to install the C++ AMP VS extension to VS2012. The custom setup page allows you to individually select those features you want to install. The item you need is “Nsight C++ AMP Debugger”. Select it, hit Next, and let setup continue.
Remote Installation
- On the remote machine a similar installation process is required. Again you run the installer and select “Customize”. This time the item to install is “Nsight C++ AMP Target Support for MSVSMON”.
- Disable Tdr (Timeout Detection and Reset) on the remote machine:
- Under key HKLM\System\CurrentControlSet\Control\GraphicsDrivers, add TdrLevel (REG_DWORD) and set its value to 0.
- Reboot the remote machine so that the new Tdr setting takes effect.
Debugging
Now that the Nvidia extension is installed you can start debugging an application. The general instructions for remote debugging are in the blog post Remote GPU Debugging in Visual Studio 11. The following changes are required:
In Step 1, you cannot use a Remote Desktop Connection to log into the remote machine, you must log into a display that is physically connected to the machine before you run msvsmon.exe.
In Step 2, you will need to:
- Set “Debugging Accelerator Type” to “NVIDIA GPU”
Now place your breakpoint, hit F5 and enjoy! Remember that while you are stopped at a breakpoint the GPU is really stopped, so the display will be frozen until you continue.
Comments
Anonymous
February 06, 2013
Very Interesting! some questions: *"because of current limitations in the driver" means of Nvidia driver or WDDM driver model 1.2 i.e. is going to be fixed by new Nvidia driver or needs need Microsoft OS with revised WDDM to fix this? *Also seems Nsight 3.0 have some sort of emulation of GPU preemption so I can debug GLSL shaders and DX ones with only one GPU and without remote debugging.. what's holding that for AMP debugging is in fact Microsoft GPU debugging APIs for interop with IHVs or Nvidia limitation now? Concluding I would want to say for future would be very interesting at least if even without preemption emulation at least is possible to use only one (local) system altough requiring 2 GPUs, the debugging one as headless display for not hanging display while debugging and the other for display.. that's also have been possible in Nsight for debugging CUDA code for more than a year already I think.. thanks..Anonymous
February 07, 2013
The driver limitations referred to are Nvidia driver limitations. In regards to GPU preemption and local debugging on 2 GPU systems, the Nvidia Developer Zone: devtalk.nvidia.com/.../nsight-visual-studio-edition may be a better place to ask questions about features of Nsight 3.0.


