Harmful Debugger Behavior
Orchestration debugger can be a life-saver when looking for troublesome processing. This is one of the great things BizTalk can do while working with the development environment. This tool should be used with extreme care in a production environment. It can block processing. BizTalk will show lots of activity with little output. Recently a customer had a problem resulting in thousands of suspended artifacts. It turns out one orchestration was in “In Breakpoint” mode. This shows in the console when viewing orchestrations. In this case it was one in thousands.
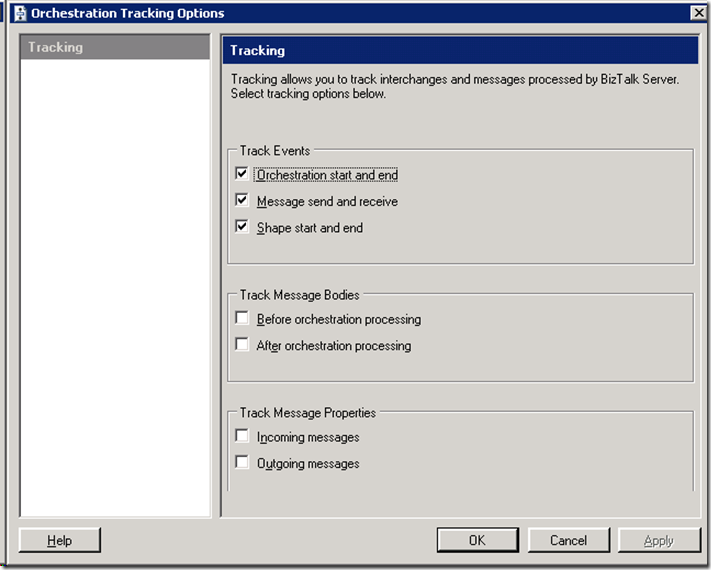
This leads to some good advice. When deploying applications along with making sure tracking is turned off for all artifacts (pipelines are on by default), turn off the ability to set breakpoints.
If the “Track Events” section checkbox for “Shape start and end” is disabled then orchestration breakpoints cannot be set. If a breakpoint has been set right click on the orchestration and clear all breakpoints. This sounds like a no brainer, but not when looking for one orchestration in thousands. No errors are provided. BizTalk does not stop working. The behavior is somewhat unpredictable because it depends on the orchestration and the application design as to the behavior.
Comments
- Anonymous
April 20, 2010
Hi,Did you manually resume orchestrations instances in a breakpoint in question?I recently helped someone on the BizTalk forums with the following to resume the orchestration instances via code:http://connectedthoughts.wordpress.com/2010/02/10/resume-orchestration-instances-in-breakpoint-via-code/Regards,Thiago Almeida
