Finding Memory Leaks in WPF-based applications
Last update: Sep, 15th, 2009
There are numbers of blogs that folks wrote about memory leaks in Microsoft .Net Framework managed code and unmanaged code based applications.
In this blog I wanted to:
- Show coding practices that can cause memory leaks which are more unique to WPF-base apps
- Share information about memory leaks in the .NET Framework;
- Show how to avoid these leaks
- Discuss the tools and techniques available to detect the leaks
I plan to update this blog with more code samples as we continue to investigate customers’ applications and find additional platform leaks or coding practices that cause memory leaks in WPF-based applications.
The Sample
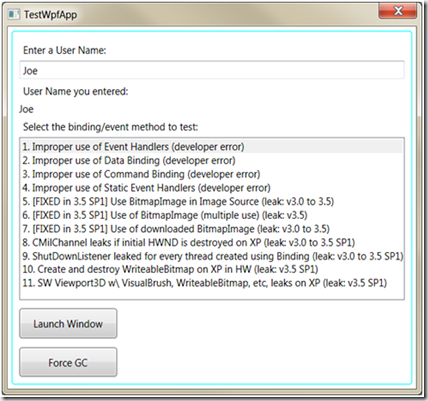
To illustrate the issues I attached a sample application. The application can launch different child windows; each can cause a separate memory leak. In each of the cases, closing the child window does not actually release the memory held by Window object as you would expect.
For clarity, I’ve included a table of the leaks:
Leak Description |
Developer Error |
NETFX 3.0 |
NETFX 3.5 |
NETFX 3/5 sp1 |
Improper Use of Event Handlers |
X |
|
|
|
Improper Use of Data Binding |
X |
|
|
|
Improper Use of Command Binding |
X |
X |
X |
X |
Improper Use of Static Event Handlers |
X |
|
|
|
Use BitmapImage in ImageSource |
|
X |
X |
|
Multiple Use of BitmapImage |
|
|
X |
|
Use of downloaded BitmapImage |
|
X |
|
|
CMilChannel leaks if initial HWND destroyed on XP |
|
X (XP only) |
X (XP only) |
X (XP only) |
ShutdownListener leaked for each thread using Binding |
|
X |
X |
X |
Create and Destroy WriteableBitmap on XP in HW |
|
|
|
X (XP in HW Only) |
SW Viewport 3D w/ VisualBrush, WB, etc. leaks on XP |
X (XP in HW Only) |
The Leak
To see the leak:
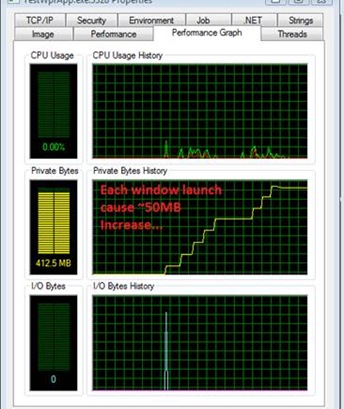
- On Windows Vista, launch Process Explorer. Open the process property dialog for your app (Right-Click/Properties)
- Launch few of the Child windows.
- Notice memory grows by ~50MB on each launch.
- Close a dialog without checking the checkbox (e.g. “Clear events on Close to avoid memory Leak”.)
- Click of “Force GC” to force garbage collection.
- Notice memory is not re-claimed
- Repeat (4)+(5) , but now check each of the Checkbox. This will free the objects being held when window closes. Notice in Process Explorer that memory is now reclaimed.
Each of the child windows causes a leak because of the reasons below.
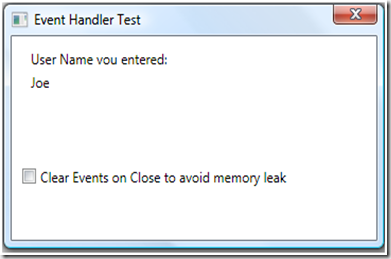
1. Use of Event Handler
Figure 1-Leak caused by use of Event Handler
Cause:
This leak is triggered because the child window (Window2) has a reference (it registered to an event) to Window1 TextBox1 which remains alive causing the Window2 object and its element tree to remain alive.
In general, if you do this:
Foo.SomeEvent += new EventHandler(Bar.SomeMethod)
Then when you done using Bar, but you are still using Foo then Bar will still remain alive as well. Not what you might have expected.
Code:
Window1.w1.TextBox1.TextChanged += new TextChangedEventHandler(this.TextBox1_TextChanged);The Window2 object will remains “alive” as long as TextBox1 in Windows1 remain alive.
The Fix/Workaround:
There are couple of approaches, the easiest one is simply to un-register the Windows2 object from its various event sources when the windows is about to close.
e.g.:
Window1.w1.TextBox1.TextChanged -= new TextChangedEventHandler(TextBox1_TextChanged);
The second approach is to create some sort of indirections (e.g. “Weak references”). See this Greg Schechter's blog for an example.
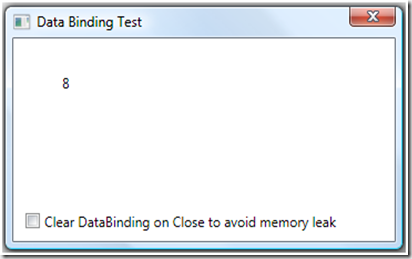
2. Use of Data Binding
Figure 2 - Leak caused by use of Data Binding
Cause:
This leak documented in this kb article. It is triggered because:
The TextBlock control has a binding to an object (myGrid) that has a reference back to the TextBlock (it is one of myGrid children’s).
Note that this type of a DataBinding leak is unique to a specific scenario (and not to all DataBinding scenarios) as documented in the kb article. The property in the Path is a not a DependencyProperty and not on a class which implements INotifyPropertyChanged and in addition a chain of strong reverences must exist.
Code:
 myDataBinding = new Binding("Children.Count");
myDataBinding.Source = myGrid;
myDataBinding.Mode = BindingMode.OneWay;
MyTextBlock.SetBinding(TextBlock.TextProperty, myDataBinding);
Same leaky code can be also written in XAML:
<TextBlock Name="MyTextBlock" Text="{Binding ElementName=myGrid, Path=Children.Count}" />
Fix/Workaround:
There are few of approaches, the easiest one is simply to clear the binding when the windows is about to close.
e.g.:
BindingOperations.ClearBinding(MyTextBlock, TextBlock.TextProperty);Other approach is to set the mode of the data binding to OneTime. See the kb article for other ideas.
3. Use of Command Binding
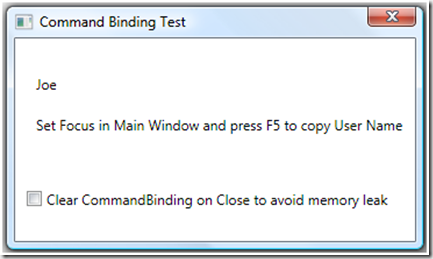
Figure 3 - Leak caused by use of Command Binding
Cause:
This leak triggered because Window2 object adds a command binding to Window 1.
WPF Command Binding uses strong reference which causes the Windows2 object child window not be released as long as Windows2 remain alive.
Code:
 command = new RoutedCommand("ClearBox", this.GetType());
command.InputGestures.Add(new KeyGesture(Key.F5));
myCmdBinding = new CommandBinding(command, F5CommandExecute);
Window1.w1.CommandBindings.Add(myCmdBinding); //add binding to Window 1
Note : This is likely not a common code practice, but it is provided to demonstrate the idea certain usage of Command Binding can cause leaks.
Fix/Workaround:
The easiest approach is simply to clear the CommandBinding when the windows is about to close.
E.g.:
Window1.w1.CommandBindings.Remove(myCmdBinding);
4. Use of Static Event Handler
Figure 4 - Leak caused by use of Command Binding
Cause:
This leak is triggered because the child window (Window2) has a reference (it registered to an event) to a Static event. Since object is static, Windows2 object will never get released.
Code:
Application.Current.Activated += new EventHandler(App_Activated);
The Fix/Workaround:
Simply un-register the Windows2 object from the event sources when the windows is about to close.
e.g.:
Application.Current.Activated -= new EventHandler(App_Activated);The second approach is to create You can consider other approaches like (1) from before.
5. Use of BitmapImage in Image Source
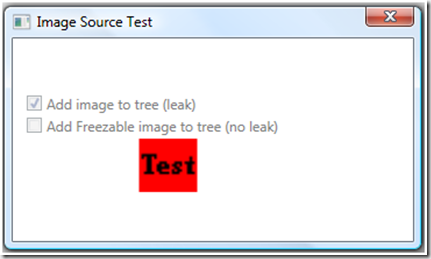
Figure 5 - Leak caused by use of BitmapImage as Image Source
Cause:
This leak is triggered because under the covers WPF keeps a strong reference between the static BitmapImage (bi1) and the Image (m_Image1).
BitmapImage (bi1) is declared Static so it is not Garbage Collected when Window2 is closed, since under the covers WPF hooks events on the BitmapImage (for example the DownloadFailed event) it causes the m_Image1 Image to remain alive.
This in turn causes the entire Window2 tree to also remain alive in memory even after you closed it.
This leak can happen only when you use BitmapImage. It does not appear when you use DrawingImage for example.
This issue is fixed in the next .Net service pack (.Net 3.5 Sp1)
Code:
bi1 = //bi1 is staticnew BitmapImage(new Uri("Bitmap1.bmp",UriKind.RelativeOrAbsolute));//bi1.Freeze() //if you do not Freeze, your app will leak memorym_Image1 = new Image();m_Image1.Source = bi1;MyStackPanel.Children.Add(m_Image1);
The Fix/Workaround:
Workaround can depends on your sceanrio. One workaround would be to Freeze the BitmapImage.
WPF does not hook events for objects that are frozen.
This woraround is used if you click on the 2nd checkbox above. Another workaround could be to Clone the BitmapImage or not to make it Static.
In general you should Freeze objects whenever possible to improve the performance of your application and reduces its working set. Read more here.
E.g.:
bi1.Freeze();
6. Use of BitmapImage in Image Source (Multiple Use)
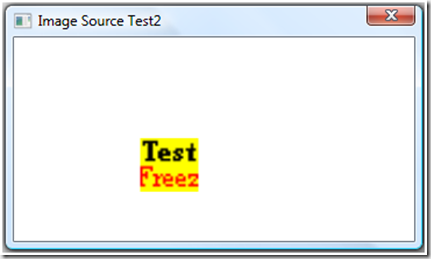
Figure 6 - Leak caused by use of BitmapImage as Image Source (multiple use)
Cause:
This leak is related to the leak mentioned above.
This leak is triggered because under the covers WPF keeps a strong reference between the static BitmapImage (bi1) and the Image (m_Image1).
When the Image gets assigned a new source (e.g. m_Image1.Source = bi2;), WPF “forgot” to remove the previous “old” events it hooked under the covers for bi1.
Again, since bi1 is static and is not Garbage Collected, it forces the Image to remain alive which causes the entire Windw2 to leak.
This issue was introduced in .Net 3.5. It does not exist in .Net 3.0.
It is fixed in the next .Net service pack (.Net 3.5 Sp1)
Code:
static BitmapImage bi1 =new BitmapImage(new Uri("Bitmap1.bmp", UriKind.RelativeOrAbsolute)); static BitmapImage bi2 =new BitmapImage(new Uri("Bitmap2.bmp", UriKind.RelativeOrAbsolute)); … if (bi2.CanFreeze) bi2.Freeze();//bi1.Freeze() //even though you are really using bi2 for Image Source, you also need to Freeze bi1 it to avoid leak m_Image1 = new Image(); m_Image1.Source = bi1; // use un-frozen bitmap, which causes the leak m_Image1.Source = bi2; // use frozen bitmap MyStackPanel.Children.Add(m_Image1);
The Fix/Workaround:
The workaround is simply not use the code above or also Freeze the other BitmapImage e.g.: bi1.Freeze();
7. Use of downloaded BitmapImage in Image Source
Figure 7 - Leak caused by use of downloaded BitmapImage as Image Source
Cause:
This leak is triggered because WPF does not remove internal reference to certain objects (such as LateBoundBitmapDecoder, BitmapFrameDecode, etc) which are used during web download and causes the leak.
This leak only happens when you download an image from the internet. (E.g. it does not appear when you load images from your local machine)
This issue will get fixed in the next .net service pack (.Net 3.5 Sp1)
To see the leak, you can launch above window, close it, and click on the ‘Force GC’ button to force garbage collection.
When you run the below commands in WinDbg, you will notice among others the following objects that remain in the heap. These are the objects that cause the leak and hold on to the Image control and the entire tree after you closed the Window2.
.loadby sos mscorwks!DumpHeap -type System.Windows.Media.Imaging53dadf18 6 72 System.Windows.Media.UniqueEventHelper`1[[System.Windows.Media.Imaging.DownloadProgressEventArgs, PresentationCore]]53da4374 1 108 System.Windows.Media.Imaging.PngBitmapDecoder53da09e0 4 112 System.Windows.Media.Imaging.BitmapSourceSafeMILHandle53d8d2f0 1 120 System.Windows.Media.Imaging.LateBoundBitmapDecoder53da0524 1 172 System.Windows.Media.Imaging.BitmapFrameDecode53da89c8 3 648 System.Windows.Media.Imaging.BitmapImage
Code:
 // You will see leak when using BitmapImage loaded from the Internet
BitmapImage image = new BitmapImage();
image.BeginInit();
image.UriSource = new Uri(@https://www.somesite.com/some_image.png,
UriKind.RelativeOrAbsolute); image.CacheOption = BitmapCacheOption.OnLoad; image.CreateOptions = BitmapCreateOptions.None; image.EndInit(); m_Image1 = new Image(); m_Image1.Source = image; MyStackPanel.Children.Add(m_Image1);
The Fix/Workaround:
The workaround is to consider downloading the BitmapImage first in other means to a temporary folder or to memory and then use the local BitmapImage . (See WebClient.DownloadFile & WebClient.DownloadData APIs)
8. CMilChannel leaks if initial HWND is destroyed on XP
Cause:
This is a leak in WPF present in versions of the framework up to and including .NET 3.5 SP1. This occurs because of the way WPF selects which HWND to use to send messages from the render thread to the UI thread. This sample destroys the first HWND created and starts an animation in a new Window. This causes messages sent from the render thread to pile up without being processed, effectively leaking memory.
The Fix/Workaround:
The workaround is to create a new HwndSource first thing in your App class constructor. This MUST be created before any other HWND is created by WPF. Simply by creating this HwndSource, WPF will use this to send messages from the render thread to the UI thread. This assures all messages will be processed, and that none will leak.
Note: This issue is rare; only implement the workaround if you’re actually hitting this problem.
9. ShutDownListener leaked for every thread created using Binding
Cause:
This is a leak in WPF present in versions of the framework up to and including .NET 3.5 SP1. This occurs because an event handler in WPF’s data binding engine is hooked but never unhooked whenever binding is used on a new thread. This sample creates a number of new Threads, and for each creates a new Window using data binding.
The Fix/Workaround:
None Available
10. Create and destroy WriteableBitmap on XP in hardware rendering
Cause:
This is a leak in WPF present in version 3.5 SP1 ONLY. This occurs whenever a WriteableBitmap is created and destroyed on Windows XP using hardware rendering. This sample repeatedly creates, updates, and displays new WriteableBitmaps continuously to leak memory.
The Fix/Workaround:
Force software rendering for the Window containing the WriteableBitmap by setting HwndTarget.RenderMode to RenderMode.SoftwareOnly.
11. Viewport3D w/ VisualBrush, WriteableBitmap, etc, leaks in Windows XP in SW
This is a leak in WPF present in version 3.5 SP1 ONLY. This occurs when a VisualBrush, WriteableBitmap, or some select other classes are used within a Viewport3D in software rendering mode.
The Fix/Workaround:
If available, use HW rendering. If HW rendering is not available, and you suspect that you’re hitting this leak, try replacing your brush with a SolidColorBrush to see if the leak goes away. If the leak persists, you have another leak in your application. If the leak goes away consider using a different brush that does not leak; no other workaround is available.
Debugging the leak
To experiment with finding the leak I used both CLR Profiler for the .NET Framework 2.0 and WinDbg and both seem adequate. The advantage is that both are free downloads.
Useful tips:
I found that:
It is much easier to detect a leak if you purposely make it very large. E.g. add 50MB to the size of the objects that you suspect to be leaking. In my example I am allocating ~50MB of memory in each child window (byte[]).
If you only have a small leak it may require many iterations before you can conclude that leak exists when using Process Explorer or Task Manger.
Forcing Garbage Collector to reclaim memory helps to differentiate between objects that leak and the ones that don’t. This code should do it:
              GC.Collect();
             GC.WaitForPendingFinalizers();
             GC.Collect();
Forcing the GC is useful when you visually inspect memory (e.g. using Process Explorer), if you use the CLR Profiler it already force GC between each heap snapshot.
Using CLR Profiler
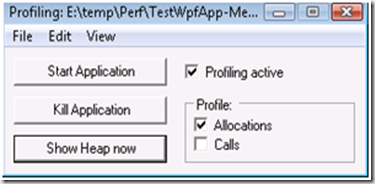
- Launch the CLR Memory Profiler as admin on Vista
- Uncheck “Allocations”, “Calls” & “Profiling Active” checkboxes
- Do “Start Application” and get the app to the point where you ready to take the ‘before’ heap snapshot.
- Then click “Show Heap Now”
- Now check the “Profiling Active” & “Allocations” to enable profiling.
- Launch and then close the ‘leaky’ window (e.g. “Event Handler test”)
- Take another “Show Heap Now”.
- Right-click on the last graph and “Show New Objects”.
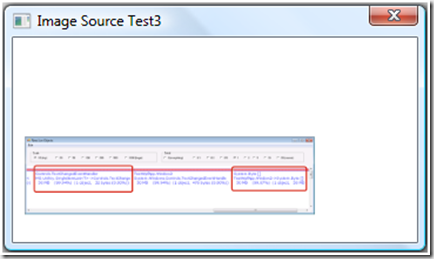
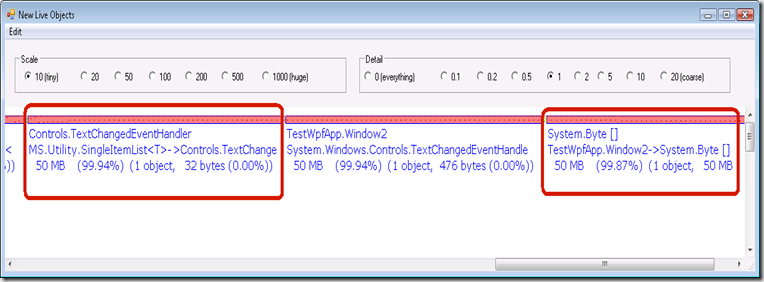
You can see that my TextChangedEventHandler is holding on to 50MB of Byte[], as in image below:
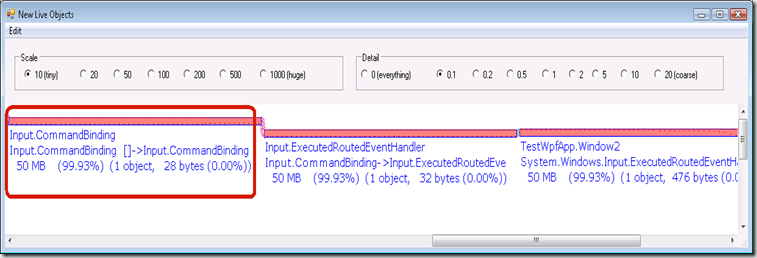
Repeating the process for the “Command Binding test” window, shows the 50MB of CommandBinding object. See image:
Using WinDBG
Pretty much followed the directions provided in this blog here.
windbg -p <your process id>
0:004> .loadby sos mscorwks
I performed:
0:005> !DumpHeap –stat
Twice (before and after the leak)
“!DumpHeap –stat” showed this before the leak happened:
…
5695e56c 460 18400 System.Windows.DependencyProperty
5696975c 188 20280 System.Windows.EffectiveValueEntry[]
79135df4 99 34440 System.Reflection.CustomAttributeNamedParameter[]
0056ed60 297 37656 Free
7913b600 177 65376 System.Collections.Hashtable+bucket[]
7912b884 3307 152020 System.Object[]
790fc6cc 8516 455296 System.String
Total 32362 objects
After the leak “!DumpHeap –stat” showed this :
5543b1e8 189 11340 System.Windows.Markup.BamlAttributeInfoRecord
53d0d3ac 40 11424 System.Windows.ClassHandlers[]
569698f4 384 11888 MS.Utility.FrugalMapBase+Entry[]
790febbc 627 12540 System.RuntimeType
5695e7c0 628 12560 System.Windows.DependencyProperty+FromNameKey
5696975c 244 15928 System.Windows.EffectiveValueEntry[]
5542d18c 676 16224 System.Windows.FrameworkPropertyMetadata
5695e56c 484 19360 System.Windows.DependencyProperty
7913b600 80 38952 System.Collections.Hashtable+bucket[]
7912b884 785 73608 System.Object[]
0056ed60 288 103380 Free
790fc6cc 7218 373856 System.String
7913b858 57 52433700 System.Byte[]
A ‘suspicions’ allocation of 50MB of byte[] is shown
I then performed:
0:005> !dumpheap -type System.Byte[]
…
013894d4 7913b858 60
0138965c 7913b858 228
013897c0 7913b858 60
01389a70 7913b858 60
0138f6d4 7913b858 500
06dc1000 7913b858 52428816
total 57 objects
Statistics:
MT Count TotalSize Class Name
7913b858 57 52433700 System.Byte[]
Total 57 objects
I then performed gcroot on the largest allocation and windbg reported
0:005> !gcroot 06dc1000
Note: Roots found on stacks may be false positives. Run "!help gcroot" for
more info.
Scan Thread 0 OSTHread 1280
ESP:37f2d8:Root:012f6d68(System.Windows.Threading.Dispatcher)->
0130c6b0(System.Windows.Input.InputManager)->
0130cd58(System.Windows.Input.StylusLogic)->
0130ce8c(System.Collections.Generic.Dictionary`2[[System.Object, mscorlib],[System.Windows.Input.PenContexts, PresentationCore]])->
0130ced8(System.Collections.Generic.Dictionary`2+Entry[[System.Object, mscorlib],[System.Windows.Input.PenContexts, PresentationCore]][])->
0135e1e8(System.Windows.Interop.HwndSource)->
012fab4c(TestWpfApp.Window1)->
01334b90(System.Windows.Controls.TextBox)->
0136f664(System.Windows.EffectiveValueEntry[])->
0134deb0(System.Windows.EventHandlersStore)->
01383340(MS.Utility.ThreeObjectMap)->
01383320(MS.Utility.FrugalObjectList`1[[System.Windows.RoutedEventHandlerInfo, PresentationCore]])->
0138332c(MS.Utility.SingleItemList`1[[System.Windows.RoutedEventHandlerInfo, PresentationCore]])->
01383300(System.Windows.Controls.TextChangedEventHandler)->
0137e2d8(TestWpfApp.Window2)->
06dc1000(System.Byte[])
Scan Thread 2 OSTHread 1500
DOMAIN(005656C8):HANDLE(WeakSh):c1794:Root:01384aec(System.EventHandler)->
01384828(System.Windows.Documents.AdornerLayer)->
0137e2d8(TestWpfApp.Window2)
This is pretty much the same info that the CLR memory Profiler reported.
Other tools
There are other third-party memory profilers such as SciTech’s Memory Profiler , Red-Gate’s ANTS Profiler , YourKit Profiler, JetBrains dotTrace 3.0 and others. All provide nice and richer user interface and better support than the tools I used above.
Other types of leaks
There are other types of managed memory leaks but outside the scope of this blog.
One such typical leak is when a managed object is holding onto unmanaged resources.
This can occur when:
a) Managed objects that hold on to the unmanaged resources and do not clean-up after themselves as they suppose to (typically in the IDisposable implementation).
b) Very small managed object that holds onto a large amount of unmanaged memory. The garbage collector sees only small amount of managed memory and does not realize that collection is required. This scenario is typically common with bitmaps since bitmaps have a small managed component holding on to a large size of unmanaged memory.
This scenario is improved in .Net 2.0 with the introduction of the AddMemoryPressure API which allows objects to tell the garbage collector of the unmanaged allocation size.
WPF internally already forces garbage collection, so the recommendation to consider using the AddMemoryPressure API is only if you have a similar scenario in your own app.
Summary
In all the patterns above, the underlying issue is the usage of strong references to objects that remain alive. Some of these strong references are implemented by the underlying WPF Framework; however the concept of strong reference used by event handler is not new in WPF and existed since the first version of .Net Framework and Winform.
Memory leaks are potentially more evident in WPF because of some new programming concepts WPF exposes and the internal WPF implementation. In addition, a typical WPF application is much richer in graphics and media, so if the app does leak memory, the leak is typically of a significant size and is easily noticeable. This makes it more important for app developers to be careful and avoid leaks in their apps.
Useful resources
- Ian Griffiths' blog entry: "Simulating Weak Delegates for EventHandler-like Delegates"
- Greg Schechter’s Simulating “Weak Delegates” in the CLR
- Rico Mariani's Performance Tidbits
- CLR Profiler for the .NET Framework 2.0
- WinDbg
- Third-party memory profilers: SciTech’s Memory Profiler , Red-Gate’s ANTS Profiler , YourKit Profiler, JetBrains dotTrace 3.0 and others which I have not listed.
Special thanks to Adam Smith, Eric Harding and Momin Al-Ghosien who helped in review and Mike Cook who contributed to this blog.
Comments
Anonymous
February 04, 2008
PingBack from http://msdnrss.thecoderblogs.com/2008/02/04/finding-memory-leaks-in-wpf-based-applications/Anonymous
February 07, 2008
I spent a quite a bit of time late in Blend tracking down memory leaks. Jossef has written the articleAnonymous
February 07, 2008
I spent a quite a bit of time late in Blend tracking down memory leaks. Jossef has written the articleAnonymous
February 08, 2008
I was just bitten by the event handler reference bug where a WPF control was referencing a disposed WinForms Form which caused the WinForm Form to stay around long after it was closed & disposed :^( .Anonymous
March 07, 2008
A quick note that can save you a lot of pain later: I mentioned a while back that binding to an ObservableCollection<T>Anonymous
March 07, 2008
A quick note that can save you a lot of pain later: I mentioned a while back that binding to an ObservableCollection<T>Anonymous
May 04, 2008
We discovered few other potential memory leaks that WPF based application can encounter so I wanted toAnonymous
October 22, 2008
In a comment on part 2 about the photoviewer application Erno pointed out a problem with my photoviewerAnonymous
October 22, 2008
I posted a blog entry about diagnostic code that can help identify objects participating in Bindings that might cause leaks: http://code.logos.com/blog/2008/10/detecting_bindings_that_should_be_onetime.htmlAnonymous
February 10, 2009
Memory leaks are always headache of developers. Do .NET developers no longer bother to worry about memoryAnonymous
March 11, 2009
In my last post, I explained how it was possible for "hidden" event handlers to introduce memory leaksAnonymous
March 21, 2009
It's been a while since the last post was online. We have been very busy in working on one of the veryAnonymous
April 17, 2009
I am working for a couple of months now with WPF and MVVM on an a business application using .NET FrameworkAnonymous
November 12, 2009
I have published an article about leaks in .NET. It contains a link to this article. See http://weblogs.asp.net/fmarguerie/archive/2009/11/03/article-detect-avoid-memory-leaks.aspxAnonymous
January 14, 2010
For databinding other two solutions: - use DependencyProperty for your binding - simply implement INotifyPropertyValueChanged interfaceAnonymous
February 11, 2010
#8 should not be listed as on XP only. We have observed this with our application on Windows 7 as well. Not sure about Vista, but I assume it is present there since it is present in 7. Adding new HwndSource(new HwndSourceParameters()) right after creating our Application object resolved this.Anonymous
May 06, 2010
FYI, I've experienced this same leak running Windows 2008 R2. I verified it with gflags and umdh.exe. The CMilChannel call stack in question leaked 300 MB overnight for me. Putting the HwndSource() workaround into the application remedied this. You may want to update your matrix, cause it isn't XP only. I'm using .NET 3.5 SP1 with Windows 2008 R2. It is my belief that I have also Windows 7 users experiencing this as well, although I haven't confirmed it with debugging tools. I'm going to see if the fix remedies their climbing memory. If so, I'm not going to bother capturing any dumps.
