Capturing Perfview traces for ASPNET Core application
Recently, I worked with one of the customer who wanted assistance in implementing the logging and capturing the perfview traces for aspnet core web application.
So, I decided to blog on this topic and explain how to enable the logging, capture and analyze perfview trace.
I am making use of a simple ASPNET Core MVC application here to explain this.
I have the below lines in my Program.cs file:
| static void Main(string[] args){ BuildWebHost(args).Run();}public static IWebHost BuildWebHost(string[] args) => WebHost.CreateDefaultBuilder(args) .CaptureStartupErrors(true)// THE ABOVE LINE IS FOR THE STARTUP RELATED ISSUES .UseSetting(WebHostDefaults.DetailedErrorsKey,"true") //THE ABOVE LINE WILL GIVE A DETAILED ERROR PAGE IN CASE OF ANY FAILURE .UseStartup<Startup>() .UseKestrel() .ConfigureLogging((hostingContext,logging)=> { logging.AddConfiguration(hostingContext.Configuration.GetSection("Logging")); logging.AddConsole(); //THE ABOVE LINE WILL DISPLAY THE LOGS IN CONSOLE WHILE RUNNING THE APP FROM THE CMD LINE logging.AddDebug(); //THE ABOVE LINE WILL DISPLAY THE LOGS IN DEBUG OUTPUT WINDOW logging.AddEventSourceLogger(); //THE ABOVE LINE IS FOR THE PERFVIEW}) .Build(); |
Ensure that you have placed the below namespaces within your Program.cs
using Microsoft.AspNetCore.Hosting;
using Microsoft.Extensions.Logging;
using Microsoft.AspNetCore;
You can make use of the Nuget PM to install the Microsoft.Extensions.Logging component.
Go to your concerned Controller and ensure that you have referenced the logging component
| public class HomeController : Controller{ // GET: /<controller>/ private readonly ILogger _logger; public HomeController(ILogger<HomeController> logger) { _logger = logger; } public IActionResult Index() { // This code specifies the loglevel. // Ex: LogInformation, LogWarning, LogCritical, LogDebug etc _logger.LogInformation(1000, "In Index method.............."); return View(); }} |
Ensure that you have placed the below namespaces within your Controller:
using Microsoft.AspNetCore.Mvc;
using Microsoft.Extensions.Logging;
After doing the above changes, you will see the Logging information within your Debug Output window and the CMD console.
In the Debug window:
| Microsoft.AspNetCore.Hosting.Internal.WebHost:Information: Request starting HTTP/1.1 GET https://localhost:5761/home/indexMicrosoft.AspNetCore.Hosting.Internal.WebHost:Information: Request starting HTTP/1.1 GET https://localhost:5761/home/index------------------------------------Demo.Controllers.HomeController:Information: In Index method.............. Demo.Controllers.HomeController:Information: In Index method.............. |
In the CMD console:
| info: Microsoft.AspNetCore.Hosting.Internal.WebHost[1] Request starting HTTP/1.1 GET https://localhost:5762/home/indexinfo: Microsoft.AspNetCore.Hosting.Internal.WebHost[1] Request starting HTTP/1.1 GET https://localhost:5762/home/indexinfo: Microsoft.AspNetCore.Mvc.Internal.ControllerActionInvoker[1] Executing action method Demo.Controllers.HomeController.Index (Demo) with arguments ((null)) - ModelState is Validinfo: Microsoft.AspNetCore.Mvc.Internal.ControllerActionInvoker[1] Executing action method Demo.Controllers.HomeController.Index (Demo) with arguments ((null)) - ModelState is Validinfoinfo: Demo.Controllers.HomeController[1000] In Index method..............: Demo.Controllers.HomeController[1000] In Index method..............info: Microsoft.AspNetCore.Mvc.ViewFeatures.Internal.ViewResultExecutor[1] Executing ViewResult, running view at path /Views/Home/Index.cshtml.info: Microsoft.AspNetCore.Mvc.ViewFeatures.Internal.ViewResultExecutor[1] Executing ViewResult, running view at path /Views/Home/Index.cshtml.info: Microsoft.AspNetCore.Mvc.Internal.ControllerActionInvoker[2] Executed action Demo.Controllers.HomeController.Index (Demo) in 4628.1449msinfo: Microsoft.AspNetCore.Mvc.Internal.ControllerActionInvoker[2] Executed action Demo.Controllers.HomeController.Index (Demo) in 4628.1449msinfo: Microsoft.AspNetCore.Hosting.Internal.WebHost[2] Request finished in 4686.3757ms 200 text/html; charset=utf-8info: Microsoft.AspNetCore.Hosting.Internal.WebHost[2] Request finished in 4686.3757ms 200 text/html; charset=utf-8 |
Perfview Data Collection:
Download the Perfview from the below location and place it on the machine where you have the ASPNET Core app running:
https://www.microsoft.com/en-us/download/details.aspx?id=28567
Data Capture:
- Open Perfview.
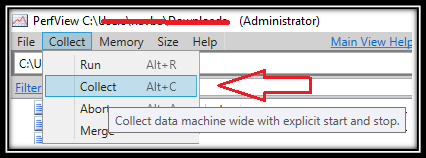
- Go to Collect and select Collect option as shown below:

- Expand the Advanced Options.
- Enable the Thread Time and IIS providers. (This will help us give some additional Information while troubleshooting) Note: IIS provider is needed if the app is hosted on IIS. Else you can skip it. This provider can be used only if the IIS Tracing feature is installed.
- Place the *Microsoft-Extensions-Logging section within Additional Providers section as shown below:

Perfview Analysis:
After we open the perfview ETL trace we see our logging information being logged:
| Event Name | Time MSec | Process Name | Rest |
| Microsoft-Extensions-Logging/FormattedMessage | 39,706.201 | dotnet (25292) | ThreadID="285,016" Level="2" FactoryID="1" LoggerName="Demo.Controllers.HomeController" EventId="1000" FormattedMessage="In Index method.............." ActivityID="//1/3/1/" |
| Microsoft-Extensions-Logging/Message | 39,708.668 | dotnet (25292) | ThreadID="285,016" Level="2" FactoryID="1" LoggerName="Demo.Controllers.HomeController" EventId="1000" Exception="{ TypeName="", Message="", HResult=0, VerboseMessage="" }" Arguments="[{ Key="{OriginalFormat}", Value="In Index method.............." }]" ActivityID="//1/3/1/" |
| Microsoft-Extensions-Logging/MessageJson | 39,708.700 | dotnet (25292) | ThreadID="285,016" Level="2" FactoryID="1" LoggerName="Demo.Controllers.HomeController" EventId="1000" ExceptionJson="{}" ArgumentsJson="{"{OriginalFormat}":"In Index method.............."}" ActivityID="//1/3/1/" |
Hope this helps :)