Elevation Profiles
Note
Bing Maps Web Control SDK retirement
Bing Maps Web Control SDK is deprecated and will be retired. Free (Basic) account customers can continue to use Bing Maps Web Control SDK until June 30th, 2025. Enterprise account customers can continue to use Bing Maps Web Control SDK until June 30th, 2028. To avoid service disruptions, all implementations using Bing Maps Web Control SDK will need to be updated to use Azure Maps Web SDK by the retirement date that applies to your Bing Maps for Enterprise account type. For detailed migration guidance, see Migrate from Bing Maps Web Control SDK and Migrate Bing Maps Enterprise applications to Azure Maps with GitHub Copilot.
Azure Maps is Microsoft's next-generation maps and geospatial services for developers. Azure Maps has many of the same features as Bing Maps for Enterprise, and more. To get started with Azure Maps, create a free Azure subscription and an Azure Maps account. For more information about azure Maps, see Azure Maps Documentation. For migration guidance, see Bing Maps Migration Overview.
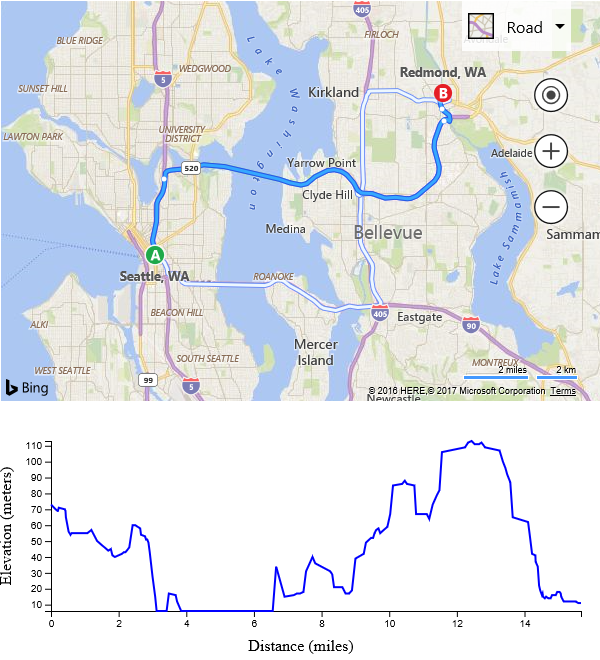
The Bing Maps REST services provides a number of useful services. The Elevation API provides elevation data from around the world. This code sample shows how to generate an elevation profile along a route.
<!DOCTYPE html>
<html>
<head>
    <title></title>
    <meta charset="utf-8" />
    <script type='text/javascript' src='https://www.bing.com/api/maps/mapcontrol?callback=GetMap' async defer></script>

    <!-- Load external jQuery and D3 libraries. -->
    <script type='text/javascript' src="http://ajax.aspnetcdn.com/ajax/jQuery/jquery-3.1.1.min.js"></script>
    <script src="https://d3js.org/d3.v4.min.js"></script>

    <script type='text/javascript'>
    var map, sessionKey;
    var elevationServiceURL = 'https://dev.virtualearth.net/REST/v1/Elevation/List';
    var maxElevationSteps = 300;

    function GetMap()
    {
        map = new Microsoft.Maps.Map('#myMap', {
            credentials: 'Your Bing Maps Key'
        });

        //Get a session key from the map and use with the REST services to make requests non-billable transactions.
        map.getCredentials(function (c) {
            sessionKey = c;
        });

        //Load the directions and spatial math modules.
        Microsoft.Maps.loadModule(['Microsoft.Maps.Directions', 'Microsoft.Maps.SpatialMath'], function () {
            //Create an instance of the directions manager.
            directionsManager = new Microsoft.Maps.Directions.DirectionsManager(map);
            directionsManager.setRequestOptions({
                routeMode: Microsoft.Maps.Directions.RouteMode.driving
            });

            //Create waypoints to route between.
            var start = new Microsoft.Maps.Directions.Waypoint({ address: 'Seatle, WA' });
            directionsManager.addWaypoint(start);

            var end = new Microsoft.Maps.Directions.Waypoint({ address: 'Redmond, WA' });
            directionsManager.addWaypoint(end);

            //Add an event handler to the directions manager.
            Microsoft.Maps.Events.addHandler(directionsManager, 'directionsUpdated', directionsUpdated);

            //Calculate directions.
            directionsManager.calculateDirections();
        });
    }

    function directionsUpdated(e) {
        //Get the current route index.
        var routeIdx = directionsManager.getRequestOptions().routeIndex;

        var route = e.route[routeIdx];

        var locs = [];
        var distances = [0];
        var incrementer = 1;

        //If there are too many locations, the URL to the elevation service will be too long for the browser.
        //For simplicity skip every n'th location.
        if (route.routePath.length > maxElevationSteps) {
            incrementer = Math.ceil(route.routePath.length / maxElevationSteps);
        }

        var distance = 0;
        var loc = route.routePath[0];

        for (var i = 1; i < route.routePath.length; i += incrementer) {
            //Calculate the current distance along the route path.
            distance += Microsoft.Maps.SpatialMath.getDistanceTo(loc, route.routePath[i], Microsoft.Maps.SpatialMath.DistanceUnits.Miles);
            distances.push(distance);

            //Add the current location to the location array.
            loc = route.routePath[i];
            locs.push(loc);
        }

        //Request elevation data from the Bing Maps REST Elevation Service.
        $.ajax({
            url: elevationServiceURL,
            data: {
                //Encode the location array as required by the elevation service.
                points: Microsoft.Maps.PointCompression.encode(locs),
                key: sessionKey,
            },
            dataType: "jsonp",
            jsonp: "jsonp",
            context: this,
            success: function (data) {
                if (data != null &&
                        data.resourceSets &&
                        data.resourceSets.length > 0 &&
                        data.resourceSets[0].resources &&
                        data.resourceSets[0].resources.length > 0) {

                    var elevations = data.resourceSets[0].resources[0].elevations;

                    createElevationProfile(distances, elevations);
                }
            },
            error: function (e) {
                alert(e);
            }
        });
    }

    function createElevationProfile(distances, elevations) {
        var data = [];

        //Combine the distances and elevations into a x/y data set that the chart control can understand.
        for (var i = 0; i < elevations.length; i++) {
            data.push({ x: distances[i], y: elevations[i] });
        }

        //Get the chart area SVG.
        var svg = d3.select('#chartArea');

        //Remove any previously generated chart content.
        svg.selectAll('*').remove();

        //Get the height and width of the SVG area.
        var width = svg.attr('width');
        var height = svg.attr('height');

        //Specify some margins around the chart.
        var margins = {
            top: 40,
            right: 20,
            bottom: 40,
            left: 50
        };

        //Create the x and y ranges.
        var xRange = d3.scaleLinear().range([margins.left, width - margins.right])
            .domain([d3.min(data, function (d) {
                return d.x;
            }), d3.max(data, function (d) {
                return d.x;
            })]);

        var yRange = d3.scaleLinear().range([height - margins.top, margins.bottom])
            .domain([d3.min(data, function (d) {
                return d.y;
            }), d3.max(data, function (d) {
                return d.y;
            })]);

        //Create the x-axis.
        svg.append('g')
            .attr('transform', 'translate(0,' + (height - margins.bottom) + ')')
            .call(d3.axisBottom(xRange));

        svg.append('text')
            .attr('x', width/2)
            .attr('y', height)
            .style('text-anchor', 'middle')
            .text('Distance (miles)');

        //Create the y-axis.
        svg.append('g')
            .attr('transform', 'translate(' + (margins.left) + ',0)')
            .call(d3.axisLeft(yRange));

        svg.append('text')
            .attr('x', -(height / 2))
            .attr('y', 10)
            .attr('transform', 'rotate(-90)')
            .style('text-anchor', 'middle')
            .text('Elevation (meters)');

        //Create a function for getting the points for the SVG path.
        var lineFunc = d3.line()
              .x(function (d) {
                  return xRange(d.x);
              })
              .y(function (d) {
                  return yRange(d.y);
              });

        //Create the elvation profile line.
        svg.append('svg:path')
            .attr('d', lineFunc(data))
            .attr('stroke', 'blue')
            .attr('stroke-width', 2)
            .attr('fill', 'none');
    }
    </script>
</head>
<body>
    <div id="myMap" style="position:relative;width:600px;height:400px;"></div>
    <svg id="chartArea" width="600" height="250"></svg>
</body>
</html>
If you run this code in a browser, you will see a map with a route from Seattle, WA to Redmond, WA displayed. Below the map will be a chart displaying the elevation profile of the route.
