Remote Debugging
Note
This article applies to Visual Studio 2015. If you're looking for the latest Visual Studio documentation, see Visual Studio documentation. We recommend upgrading to the latest version of Visual Studio. Download it here
You can debug a Visual Studio application that has been deployed on a different computer. To do so, you use the Visual Studio remote debugger.
The information here applies to Windows desktop applications and ASP.NET applications. For information about remote debugging Windows Store apps and Azure apps, see Remote Debugging on Windows Store and Azure apps.
Get the remote tools
You can either download the remote tools directly on the device or server that you want to debug, or you can get the remote tools from your host machine with Visual Studio installed.
To download and install the remote tools
On the device or server machine that you want to debug (rather than the machine running Visual Studio), get the correct version of the remote tools.
Version Link Notes Visual Studio 2015 Update 3 Remote tools If prompted, join the free Visual Studio Dev Essentials group or you can just sign in with a valid Visual Studio subscription. Then re-open the link if necessary. Always download the version matching your device operating system (x86, x64, or ARM version) Visual Studio 2015 (older) Remote tools If prompted, join the free Visual Studio Dev Essentials group or you can just sign in with a valid Visual Studio subscription. Then re-open the link if necessary. Visual Studio 2013 Remote tools Download page in Visual Studio 2013 documentation Visual Studio 2012 Remote tools Download page in Visual Studio 2012 documentation On the download page, choose the version of the tools that matches your operating system (x86, x64, or ARM version) and download the remote tools.
Important
We recommend you install the most recent version of the remote tools that matches your version of Visual Studio. Mismatched versions are not recommended.
In addition, you must install the remote tools that have the same architecture as the operating system on which you want to install it. In other words, if you want to debug a 32-bit application on a remote computer running a 64-bit operating system, you must install the 64-bit version of the remote tools on the remote computer.
When you have finished downloading the executable, follow the directions to install the application on the remote computer. See setup instructions
If you try to copy the remote debugger (msvsmon.exe) to the remote computer and run it, be aware that the Remote Debugger Configuration Wizard (rdbgwiz.exe) is installed only when you download the tools, and you may need to use the wizard for configuration later, especially if you want the remote debugger to run as a service. For more information, see (Optional) Configure the remote debugger as a service below.
To run the remote debugger from a file share
You can find the remote debugger (msvsmon.exe) on a computer with Visual Studio 2015 Community, Professional, or Enterprise already installed. For many scenarios, the easiest way to set up remote debugging is to run the remote debugger (msvsmon.exe) from a file share. For usage limitations, see the remote debugger's Help page (Help / Usage in the remote debugger).
Find msvsmon.exe in the directory matching your version of Visual Studio. For Visual Studio 2015:
Program Files\Microsoft Visual Studio 14.0\Common7\IDE\Remote Debugger\x86\msvsmon.exe
Program Files\Microsoft Visual Studio 14.0\Common7\IDE\Remote Debugger\x64\msvsmon.exe
Share the Remote Debugger folder on the Visual Studio computer.
On the remote computer, run msvsmon.exe. Follow the setup instructions.
Tip
For command line installation and command line reference, see the Help page for msvsmon.exe by typing msvsmon.exe /? in the command line on the computer with Visual Studio installed (or go to Help / Usage in the remote debugger).
Supported Operating Systems
The remote computer must be running one of the following operating systems:
Windows 10
Windows 8 or 8.1
Windows 7 Service Pack 1
Windows Server 2012 or Windows Server 2012 R2
Windows Server 2008 Service Pack 2, Windows Server 2008 R2 Service Pack 1
Supported Hardware Configurations
1.6 GHz or faster processor
1 GB of RAM (1.5 GB if running on a virtual machine)
1 GB of available hard disk space
5400 RPM hard drive
DirectX 9-capable video card running at 1024 x 768 or higher display resolution
Network configuration
The remote computer and the Visual Studio computer must be connected over a network, workgroup, or homegroup, or else connected directly through an Ethernet cable. Debugging over the Internet is not supported.
Set up the remote debugger
You must have administrative permissions on the remote computer
Locate the Remote Debugger application. (Open the Start menu and search for Remote Debugger.)
If you are running the remote debugger on a remote server, you can right-click the Remote Debugger app and choose Run as administrator (Or, you can run the remote debugger as a service).If you are not running it on a remote server, just start it normally.
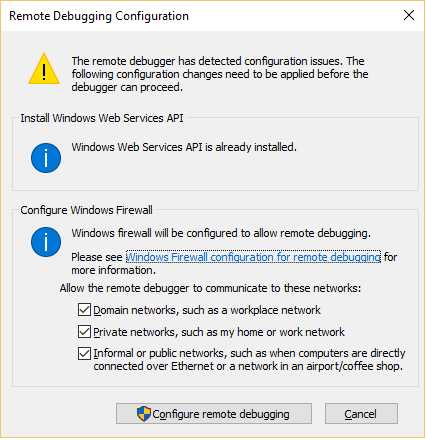
When you start the remote tools for the first time (or before you have configured it), the Remote Debugging Configuration dalog box appears.

If the Windows Service API is not installed (which happens only on Windows Server 2008 R2), choose the Install button.
Select the network types you want use the remote tools on. At least one network type must be selected. If the computers are connected through a domain, you must choose the first item. If the computers are connected through a workgroup or homegroup, you need to choose the second or third item as appropriate.
Choose Configure remote debugging to configure the firewall and start the tool.
When configuration is complete, the Remote Debugger window appears.

The remote debugger is now waiting for a connection. Make a note of the server name and port number that is displayed, because you will need this later for configuration in Visual Studio.
When you are finished debugging and need to stop the remote debugger, click File / Exit on the window. You can restart it from the Start menu or from the command line:
<Visual Studio installation directory>\Common7\IDE\Remote Debugger\<x86, x64, or Appx\msvsmon.exe.
Configure the remote debugger
You can change some aspects of the configuration of the remote debugger after you have started it for the first time.
To enable other users to connect to the remote debugger, choose Tools / Permissions. You must have administrator privileges to grant or deny permissions.
Important
You can run the remote debugger under a user account that differs from the user account you are using on the Visual Studio computer, but you must add the different user account to the remote debugger's permissions.
Alternatively, you can start the remote debugger from the command line with the /allow <username> parameter: msvsmon /allow <username@computer>.
To change the Authentication mode or the port number, or to specify a timeout value for the remote tools: choose Tools / Options.
For a listing of the port numbers used by default, see Remote Debugger Port Assignments.
Warning
You can choose to run the remote tools in No Authentication mode, but this mode is strongly discouraged. There is no network security when you run in this mode. Choose the No Authentication mode only if you are sure that the network is not at risk from malicious or hostile traffic.
(Optional) Configure the remote debugger as a service
For debugging in ASP.NET and other server environments, you must either run the remote debugger as an Administrator or, if you want it always running, run the remote debugger as a service.
If you want to configure the remote debugger as a service, follow these steps.
Find the Remote Debugger Configuration Wizard (rdbgwiz.exe). (This is a separate application from the Remote Debugger.) It is available only when you install the remote tools. It is not installed with Visual Studio.
Start running the configuration wizard. When the first page comes up, click Next.
Check the Run the Visual Studio 2015 Remote Debugger as a service checkbox.
Add the name of the user account and password.
You may need to add the Log on as a service user right to this account. (Find Local Security Policy (secpol.msc) in the Start page or window (or type secpol at a command prompt). When the window appears, double-click User Rights Assignment, then find Log on as a service in the right pane. Double-click it. Add the user account to the Properties window and click OK.) Click Next.
Select the type of network that you want the remote tools to communicate with. At least one network type must be selected. If the computers are connected through a domain, you should choose the first item. If the computers are connected through a workgroup or homegroup, you should choose the second or third items. Click Next.
If the service can be started, you will see You have successfully completed the Visual Studio Remote Debugger Configuration Wizard. If the service cannot be started, you will see Failed to complete the Visual Studio Remote Debugger Configuration Wizard. The page also gives some tips to follow to get the service to start.
Click Finish.
At this point the remote debugger is running as a service. You can verify this by going to Control Panel / Services and looking for Visual Studio 2015 Remote Debugger.
You can stop and start the remote debugger service from Control Panel / Services.
Remote debug an ASP.NET application
Deploying an ASP.NET application to a remote computer running IIS has different steps, depending on the operating system and version of IIS. For remote computers running Windows Server 2008 or Windows Server 2012 that have IIS 7.5 or later installed, please see Remote Debugging ASP.NET on a Remote IIS Computer.
If you are debugging an ASP.NET Core app, please see Publishing to IIS. Different steps are required to publish an ASP.NET Core on IIS. Once you publish an ASP.NET Core app successfully, you can remote debug it just like other ASP.NET apps, except that the process you need to attach to is dnx.exe instead of w3wp.exe.
Remote debug a Visual C++ project
In the following procedure, the name and path of the project is C:\remotetemp\MyMfc, and the name of the remote computer is MJO-DL.
Create an MFC application named mymfc.
Set a breakpoint somewhere in the application that is easily reached, for example in MainFrm.cpp, at the start of
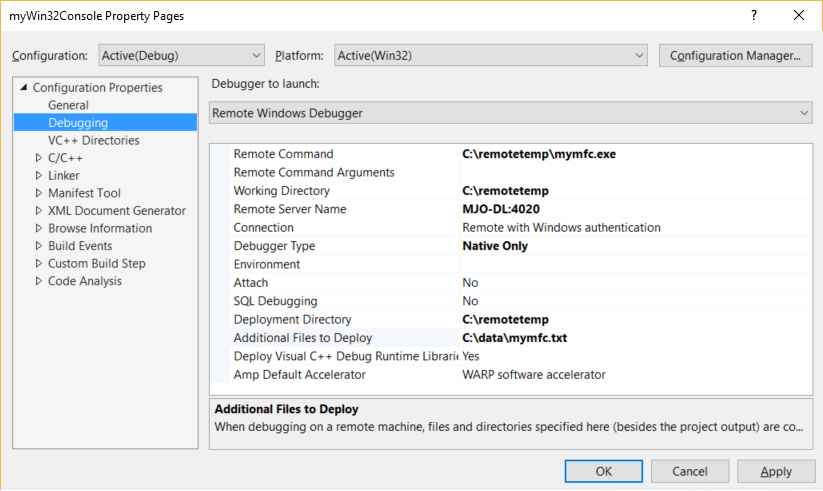
CMainFrame::OnCreate.In Solution Explorer, right-click on the project and select Properties. Open the Debugging tab.
Set the Debugger to launch to Remote Windows Debugger.

Make the following changes to the properties:
Setting Value Remote Command C:\remotetemp\mymfc.exe Working Directory C:\remotetemp Remote Server Name MJO-DL:portnumber Connection Remote with Windows Authentication Debugger Type Native Only Deployment Directory C:\remotetemp. Additional Files to Deploy C:\data\mymfcdata.txt. If you deploy additional files (optional), the folder must exist on both machines.
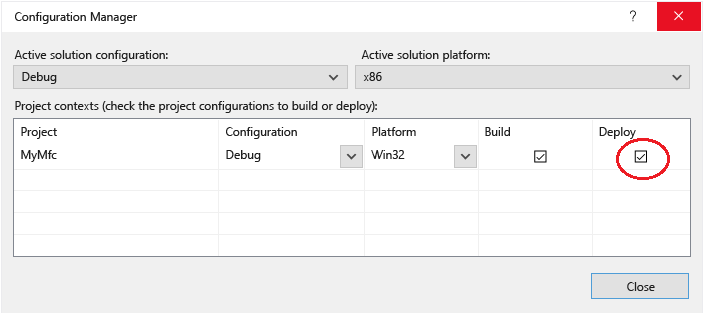
In Solution Explorer, right-click the solution and choose Configuration Manager.
For the Debug configuration, select the Deploy check box.

Start debugging (Debug / Start Debugging, or F5).
The executable is automatically deployed to the remote computer.
If prompted, enter network credentials to connect to the remote machine.
The required credentials are specific to your network's security configuration. For example, on a domain computer, you might choose a security certificate or enter your domain name and password. On a non-domain machine, you might enter the machine name and a valid user account name, like MJO-DL\name@something.com, along with the correct password.
On the Visual Studio computer, you should see that execution is stopped at the breakpoint.
Tip
Alternatively, you can deploy the files as a separate step. In the Solution Explorer, right-click the mymfc node and then choose Deploy.
If you have non-code files that need to be used by the application, you need to include them in the Visual Studio project. Create a project folder for the additional files (in the Solution Explorer, click Add / New Folder.) Then add the files to the folder (in the Solution Explorer, click Add / Existing Item, then select the files.). On the Properties page for each file, set Copy to Output Directory to Copy always.
Remote debug a Visual C# or Visual Basic project
The debugger cannot deploy Visual C# or Visual Basic desktop applications to a remote machine, but you can still debug them remotely as follows. The following procedure assumes that you want to debug it on a computer named MJO-DL, as shown in the earlier illustration.
Create a WPF project named MyWpf.
Set a breakpoint somewhere in the code that is easily reached.
For example, you might set a breakpoint in a button handler. To do this, open MainWindow.xaml, and add a Button control from the Toolbox, then double-click the button to open it's handler.
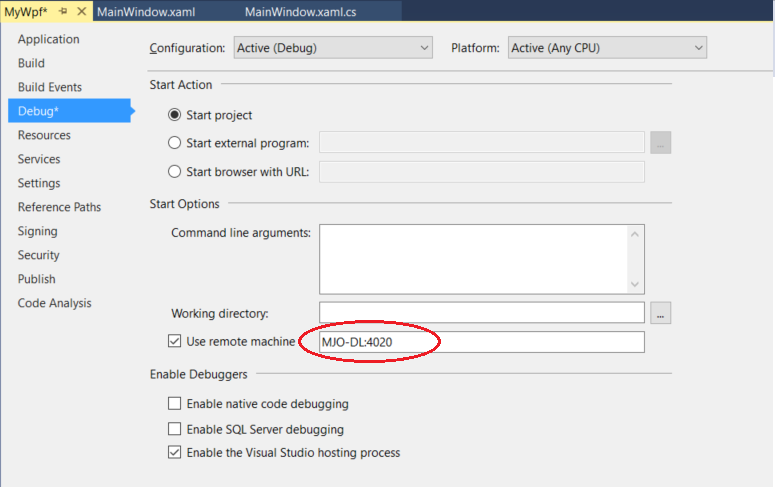
In Solution Explorer, right-click the project and choose Properties.
On the Properties page, choose the Debug tab.

Make sure the Working directory text box is empty.
Choose Use remote machine, and type MJO-DL:4020 in the text box. (4020 is the port number shown in the remote debugger window).
Make sure that Enable native code debugging is not selected.
Build the project.
Create a folder on the remote computer that is the same path as the Debug folder on your Visual Studio computer: <source path>\MyWPF\MyWPF\bin\Debug.
Copy the executable that you just built from your Visual Studio computer to the newly-created folder on the remote computer.
Caution
Do not make changes to the code or rebuild (or you must repeat this step). The executable you copied to the remote machine must exactly match your local source and symbols.
You can copy the project manually, use Xcopy, Robocopy, Powershell, or other options.
Make sure the remote debugger is running on the target machine. (If it's not, search for Remote Debugger in the Start menu. ) The remote debugger window looks like this.

In Visual Studio, start debugging (Debug / Start Debugging, or F5).
If prompted, enter network credentials to connect to the remote machine.
The required credentials vary depending on your network's security configuration. For example, on a domain computer, you can enter your domain name and password. On a non-domain machine, you might enter the machine name and a valid user account name, like MJO-DL\name@something.com, along with the correct password.
You should see that the WPF application’s main window is open on the remote computer.
If necessary, take action to hit the breakpoint. You should see that the breakpoint is active. If it isn’t, the symbols for the application haven’t loaded. Retry, and if that doesn't work, get information about loading symbols and how troubleshoot them at Understanding symbol files and Visual Studio’s symbol settings.
On the Visual Studio machine, you should see that execution has stopped at the breakpoint.
If you have non-code files that need to be used by the application, you need to include them in the Visual Studio project. Create a project folder for the additional files (in the Solution Explorer, click Add / New Folder.) Then add the files to the folder (in the Solution Explorer, click Add / Existing Item, then select the files.). On the Properties page for each file, set Copy to Output Directory to Copy always.
Set Up Debugging with Remote Symbols
You should be able to debug your code with the symbols you generate on the Visual Studio computer. The performance of the remote debugger is much better when you use local symbols. If you must use remote symbols, you need to tell the remote debugging monitor to look for symbols on the remote machine.
Starting in Visual Studio 2013 Update 2, you can use the following msvsmon command-line switch to use remote symbols for managed code: Msvsmon / /FallbackLoadRemoteManagedPdbs
For more information, please see the remote debugging help (press F1 in the remote debugger window, or click Help / Usage). You can find more information at .NET Remote Symbol Loading Changes in Visual Studio 2012 and 2013
Remote Debugging on Windows Store and Azure apps
For information about remote debugging with Windows Store apps, see Debug and test Windows Store apps on a remote device from Visual Studio.
For information about debugging on Azure, see one of these topics:
Debugging a Cloud Service or Virtual Machine in Visual Studio
Introduction to Remote Debugging on Azure Web Sites (Part 1, Part 2, Part 3).
See Also
Debugging in Visual Studio
Configure the Windows Firewall for Remote Debugging
Remote Debugger Port Assignments
Remote Debugging ASP.NET on a Remote IIS Computer
Remote Debugging Errors and Troubleshooting