Using saved IntelliTrace data
Note
This article applies to Visual Studio 2015. If you're looking for the latest Visual Studio documentation, see Visual Studio documentation. We recommend upgrading to the latest version of Visual Studio. Download it here
Go to specific points in your application's execution when you start debugging from an IntelliTrace log (.iTrace) file. This file can contain performance events, exceptions, threads, test steps, modules, and other system info that IntelliTrace records while your app runs.
Make sure that you have:
Matching source files and symbol (.pdb) files for your application code. Otherwise, Visual Studio can't resolve the source locations and shows the message "Symbols not found." See Specify Symbol (.pdb) and Source Files and Diagnose problems after deployment.
Visual Studio Enterprise (but not Professional or Community editions) on your development computer or another computer to open .iTrace files
An .iTrace file from one of these sources:
Source See An IntelliTrace session in Visual Studio Enterprise (but not Professional or Community editions) IntelliTrace Features A test session in Microsoft Test Manager. This attaches an .iTrace file to a Team Foundation Server work item. Collect more diagnostic data in manual tests Microsoft Monitoring Agent, either alone or with System Center 2012 R2 Operations Manager, for ASP.NET web apps and SharePoint applications running in deployment - Diagnose problems after deployment
- What's New for System Center 2012 R2 Operations Manager
What do you want to do?
Open an IntelliTrace log
On a computer with Visual Studio Enterprise, open the .iTrace file.
Double-click the .iTrace file outside Visual Studio, or open the file from inside Visual Studio.
- or -
If the .iTrace file is attached to a Team Foundation Server work item, follow these steps in the work item:
Under All Links, find the .iTrace file. Open it.
- or -
Under Repro Steps, choose the IntelliTrace link.
Tip
If you closed the IntelliTrace file during debugging, you can reopen it easily. Go to the Debug menu, choose IntelliTrace, Show Log Summary. You can also choose Show Log Summary in the IntelliTrace window. This is available only while debugging with IntelliTrace.
Understand the IntelliTrace log
Some of the following sections in the .iTrace file appear only if you collected data from a particular source, for example, from Test Manager or from SharePoint applications.
| Section | Contains | Collection Source |
|---|---|---|
| Performance Violations | Performance events with function calls that exceed the configured threshold | Microsoft Monitoring Agent, either alone or with System Center 2012 R2 Operations Manager for ASP.NET web apps hosted on IIS |
| Exception Data | Exceptions, including the full call stack for each exception | All sources |
| Analysis | For SharePoint 2010 and SharePoint 2013 applications only. Diagnose IntelliTrace and SharePoint events, such as debugger events, ULS events, unhandled exceptions, and other data that the Microsoft Monitoring Agent recorded. | Microsoft Monitoring Agent, either alone or with System Center 2012 R2 Operations Manager |
| System Info | Settings and specifications of the host system | All sources |
| Threads List | Threads that ran during collection | All sources |
| Test Data | Test steps and their results from a test session | Test Manager |
| Modules | Modules that the target process loaded in the order that they loaded. | All sources |
Here's some tips to help you find information in each section:
Choose a column header to sort data.
Use the search box to filter data. Plain text search works across all columns except the time columns. You can also filter searches to a specific column with one filter per column. Type the column name with no spaces, a colon (:), and the search value. Follow this with a semicolon (;) to add another column and search value.
For example, to find performance events that have the word "slow" in the Description column, type:
Description:slow
Start debugging from an IntelliTrace log
Performance Violations
Review the performance events that were recorded for your app. You can hide those events that don't happen often.
To start debugging from a performance event
Under Performance Violations, review the recorded performance events, their total execution times, and other event information. Then dig deeper into the methods that were called during a specific performance event.
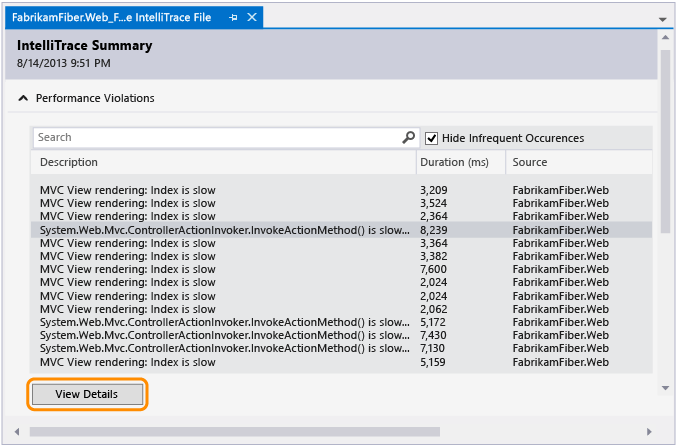
You can also just double-click the event.
On the event page, review the execution times for these calls. Find a slow call in the execution tree.
The slowest calls appear in their own section when you have multiple calls, nested or otherwise.
Expand that call to review any nested calls and parameter values that were recorded at that point in time.
(Keyboard: To show or hide a nested call, press the Right Arrow or Left Arrow key respectively. To show and hide parameter values for a nested call, press the Space key.)
Start debugging from the call.
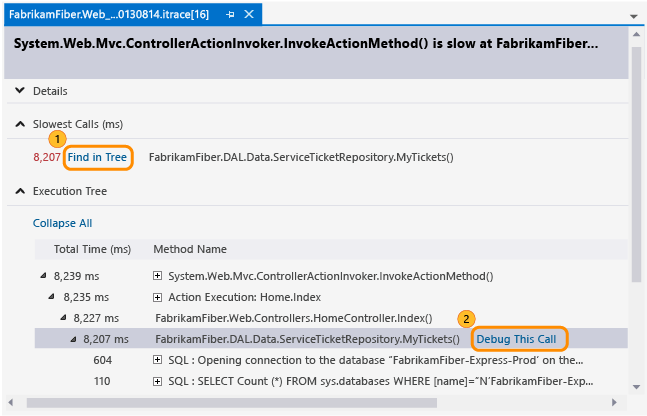
You can also just double-click the call or press the Enter key.
If the method is in your application code, Visual Studio goes to that method.
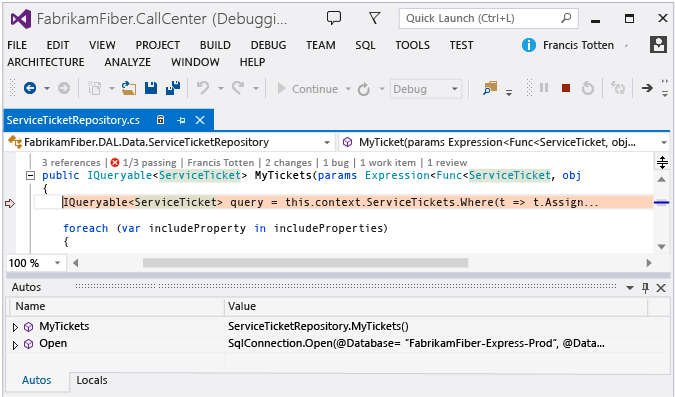
Now you can review other recorded values, the call stack, step through your code, or use the IntelliTrace window to move backwards or forwards "in time" between other methods that were called during this performance event.
Exception Data
Review the exceptions that were thrown and recorded for your app. You can group exceptions that have the same type and call stack so that you see only the most recent exception.
To start debugging from an exception
Under Exception Data, review the recorded exception events, their types, messages, and when the exceptions happened. To dig deeper into the code, start debugging from the most recent event in a group of exceptions.
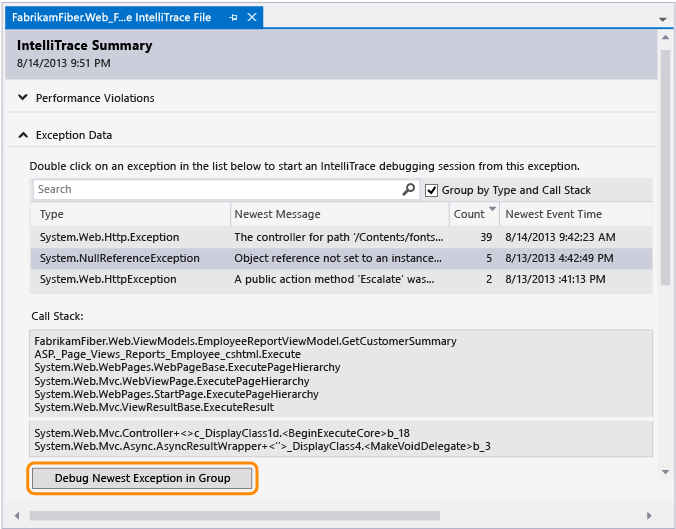
You can also just double-click the event. If the events aren't grouped, choose Debug This Event.
If the exception happened in your application code, Visual Studio goes to where the exception happened.
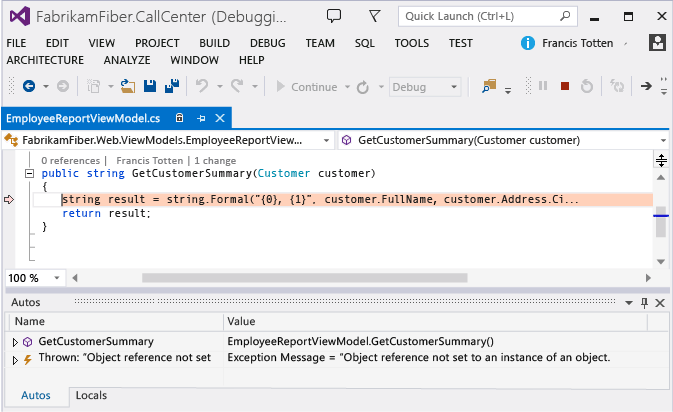
Now you can review other recorded values, the call stack, or use the IntelliTrace window to move backwards or forwards "in time" between other recorded events, related code, and the values recorded at those points in time.
Column Shows the Type .NET type of the exception Newest Message for grouped exceptions or Message for ungrouped exceptions The message provided by the exception Count for grouped exceptions The number of times the exception was thrown Thread ID for ungrouped exceptions ID of the thread that threw the exception Newest Event Time or Event Time Time stamp recorded when the exception was thrown Call Stack Call stack for an exception.
To see the call stack, choose an exception in the list. The call stack appears below the exception list.
Analysis
Diagnose problems with SharePoint 2010 and SharePoint 2013 applications by using a SharePoint correlation ID or review any unhandled exceptions that Microsoft Monitoring Agent found.
Use a SharePoint correlation ID to find its matching web request and events. Choose an event and then start debugging at the point where and when the event happened.
If Microsoft Monitoring Agent found unhandled exceptions, choose an exception and then start debugging at the point where and when the exception happened.
Start debugging with a SharePoint correlation ID
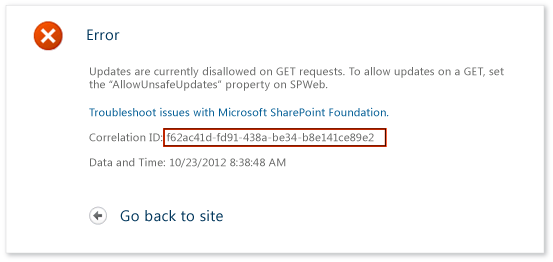
Copy the SharePoint correlation ID from its source.
For example:
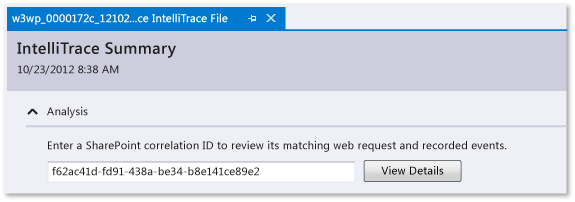
Open the .iTrace file, then go to Analysis and enter the SharePoint correlation ID to review the matching web request and recorded events.
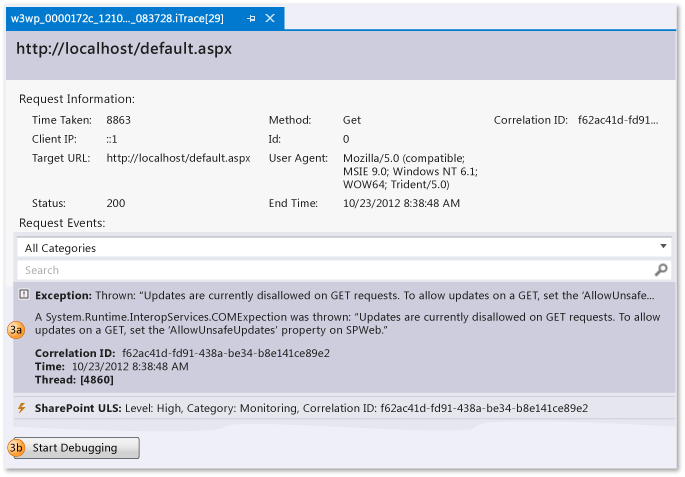
Under Request Events, examine the events. Starting from the top, events appear in the order that they happened.
Choose an event to see its details.
Choose Start Debugging to start debugging at the point where the event happened.
You can see these kinds of SharePoint events along with IntelliTrace events:
User profile events
These events happen when SharePoint loads a user profile and when user profile properties are read or changed.
Unified Logging System (ULS) events
Microsoft Monitoring Agent records a subset of SharePoint ULS events and these fields:
IntelliTrace field SharePoint ULS field Id EventID Level Level Category Id Category Id Category Category Area Product Output Message Correlation Id Correlation Id
Start debugging from an unhandled exception
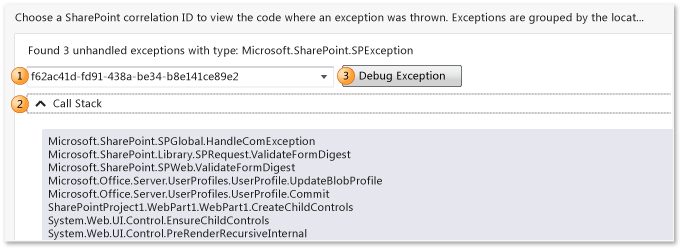
Choose a SharePoint correlation ID for an exception. Exceptions are grouped by type and call stack.
(Optional) Expand Call Stack to see the call stack for a group of exceptions.
Choose Debug Exception to start debugging at the point where and when the exception happened.
For a walkthrough, see Walkthrough: Debugging a SharePoint Application by Using IntelliTrace. For the kinds of data that the agent records, see IntelliTrace Features.
Threads List
Examine the recorded threads that ran in the target process. You can start debugging from the first valid IntelliTrace event in a selected thread.
To start debugging from a specific thread
Under Threads List, choose a thread.
At the bottom of Threads List, choose Start Debugging. You can also double-click a thread.
To start debugging from where the app begins, double-click Main Thread. See IntelliTrace Features.
Thread data that the user creates might be more useful than threads that a server creates and manages for IIS-hosted Web apps.
| Column | Shows the |
|---|---|
| ID | Thread ID number |
| Name | Thread name. Unnamed threads appear as "<No Name>". |
| Start Time | Time the thread was created |
| End Time | Time the thread was completed |
Test Data
Examine the IntelliTrace data that Test Manager recorded while testing your app.
To start debugging from a specific test step
Expand Test Steps Grid. Choose a test step.
At the bottom of Test Steps Grid, choose Start Debugging. You can also double-click a test step.
This starts debugging from the first valid IntelliTrace event after the selected test step.
When test data exists, IntelliTrace tries to resolve the associated Team Foundation Server build that was used to perform the test run. If the build is found, the associated symbols for the app are resolved automatically.
| Field | Shows the |
|---|---|
| Test Session | Test sessions that were recorded. Typically, there is only one. This list is empty if test data was created using a manual exploratory test. |
| Test Case | Test cases from the selected test session. This list is empty if test data was created using a manual exploratory test. |
| Test Steps Grid | Test steps that were recorded with the test result of pass or fail |
System Info
This section shows you details about the system that hosted the app, for example, hardware, operating system, environmental and process-specific information.
Modules
This section shows you the modules that the target process loaded. Modules appear in the order that they loaded.
| Column | Shows the |
|---|---|
| Module Name | Module file name |
| Module Path | Disk location where the module was loaded |
| Module ID | Unique identifier of the module that is version-specific and contributes to the matching symbol (PDB) files. See Finding symbol (.pdb) files and source files. |
Where can I get more information?
Using the IntelliTrace stand-alone collector
Collect more diagnostic data in manual tests
Forums
Guidance
Testing for Continuous Delivery with Visual Studio 2012 – Chapter 6: A Testing Toolbox