Analyze CPU usage without debugging in the Performance Profiler (C#, Visual Basic, C++, F#)
Applies to: ![]() Visual Studio
Visual Studio ![]() Visual Studio for Mac
Visual Studio for Mac
Note
This article applies to Visual Studio 2017. If you're looking for the latest Visual Studio documentation, see Visual Studio documentation. We recommend upgrading to the latest version of Visual Studio. Download it here
A good way to start investigating performance issues in your app is to understand its CPU usage. The CPU Usage performance tool shows the CPU time and percentage spent executing code in C++, C#/Visual Basic, and JavaScript apps. If you need to diagnose a slow-down or a process hang in your team’s codebase, the CPU Usage tool can help you diagnose the issue with your team’s production code. The tool provides automatic insights and various views of your data so that you can analyze and diagnose performance issues.
The tool is also helpful for DevOps scenarios, such as when a customer reports that some requests or orders are not getting through to the retail website during peak season. Often, the issues are in production, and it is challenging to debug at that moment, but this tool can help you capture enough information and evidence of the issue. After collecting a trace file, the analysis can quickly help you understand potential causes and give suggestions within the context of your code so that you can take the next steps to fix the issue.
The CPU Usage tool is helpful for both local trace sessions and production. It can also be initiated by using the keyboard shortcut, Alt+F2, and then CPU Usage or by opening an already collected trace using a tool like dotnet-trace or dotnet-monitor.
The CPU Usage tool can run on an open Visual Studio project, on an installed Microsoft Store app, or attached to a running app or process. You can run the CPU Usage tool with or without debugging. For more information, see Run profiling tools with or without the debugger.
The following instructions show how to use the CPU Usage tool without the debugger, using the Visual Studio Performance Profiler. The examples use a Release build on a local machine. Release builds provide the best view of actual app performance. To analyze CPU usage with Debug builds (debugger attached), see Beginner's guide to performance profiling.
Usually, the local machine best replicates installed app execution. To collect data from a remote device, run the app directly on the device, not over a Remote Desktop Connection.
Note
Windows 7 or later is required to use the Performance Profiler.
Collect CPU usage data
In the Visual Studio project, set the solution configuration to Release and select Local Windows Debugger (or Local Machine) as the deployment target.
Select Debug > Performance Profiler.
Under Available tools, select CPU Usage, and then select Start.
After the app starts, the diagnostic session begins and displays CPU usage data. When you're finished collecting data, select Stop Collection.
The CPU Usage tool analyzes the data and displays the report.
Analyze the CPU Usage report
The diagnostic report is sorted by Total CPU, from highest to lowest. Change the sort order or sort column by selecting the column headers. Use the Filter dropdown to select or deselect threads to display, and use the Search box to search for a specific thread or node.
CPU Usage data columns
| Name | Description |
|---|---|
| Total CPU [unit, %] |  The milliseconds and CPU percentage used by calls to the function, and functions called by the function, in the selected time range. This is different from the CPU Utilization timeline graph, which compares the total CPU activity in a time range to the total available CPU. |
| Self CPU [unit, %] |  The milliseconds and CPU percentage used by calls to the function in the selected time range, excluding functions called by the function. |
| Module | The name of the module containing the function. |
The CPU Usage call tree
To view the call tree, select the parent node in the report. The CPU Usage page opens to the Caller/Callee view. In the Current View dropdown, select Call Tree.
Call tree structure

| Image | Description |
|---|---|
 |
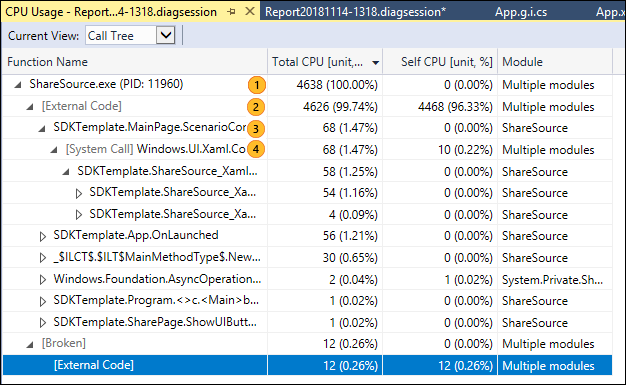
The top-level node in CPU Usage call trees is a pseudo-node. |
 |
In most apps, when the Show External Code option is disabled, the second-level node is an [External Code] node. The node contains the system and framework code that starts and stops the app, draws the UI, controls thread scheduling, and provides other low-level services to the app. |
 |
The children of the second-level node are the user-code methods and asynchronous routines that are called or created by the second-level system and framework code. |
 |
Child nodes of a method have data only for the calls of the parent method. When Show External Code is disabled, app methods can also contain an [External Code] node. |
External code
System and framework functions that are executed by your code are called external code. External code functions start and stop the app, draw the UI, control threading, and provide other low-level services to the app. In most cases, you aren't interested in external code, so the CPU Usage call tree gathers the external functions of a user method into one [External Code] node.
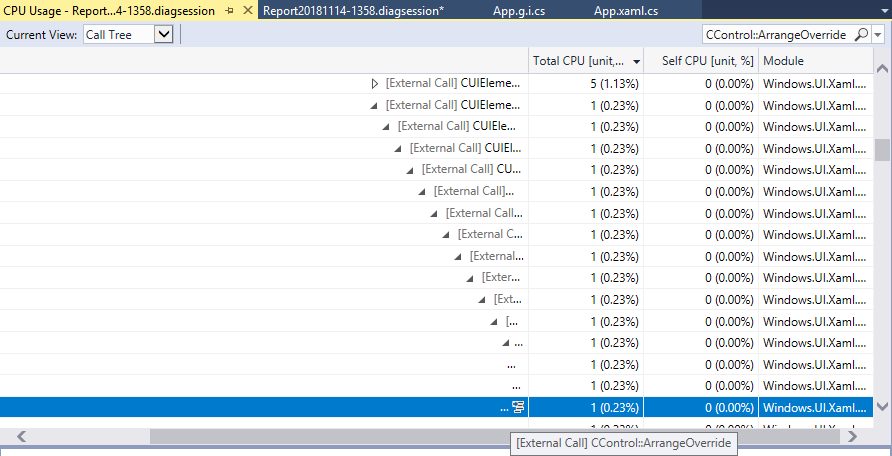
To find a function name you're looking for, use the search box. Hover over the selected line or use the horizontal scroll bar to view the data.

Asynchronous functions in the CPU usage call tree
When the compiler encounters an asynchronous method, it creates a hidden class to control the method's execution. Conceptually, the class is a state machine. The class has compiler-generated functions that asynchronously call the original methods, and the callbacks, scheduler, and iterators needed to run them. When a parent method calls the original method, the compiler removes the method from the execution context of the parent, and runs the hidden class methods in the context of the system and framework code that controls app execution. The asynchronous methods are often, but not always, executed on one or more different threads. This code appears in the CPU Usage call tree as children of the [External Code] node immediately below the top node of the tree.
Expand the generated methods to show what's going on:
MainPage::GetMaxNumberAsyncButton_Clickjust manages a list of the task values, computes the maximum of the results, and displays the output.MainPage+<GetMaxNumberAsyncButton_Click>d__3::MoveNextshows you the activity required to schedule and launch the 48 tasks that wrap the call toGetNumberAsync.MainPage::<GetNumberAsync>b__bshows the activity of the tasks that callGetNumber.