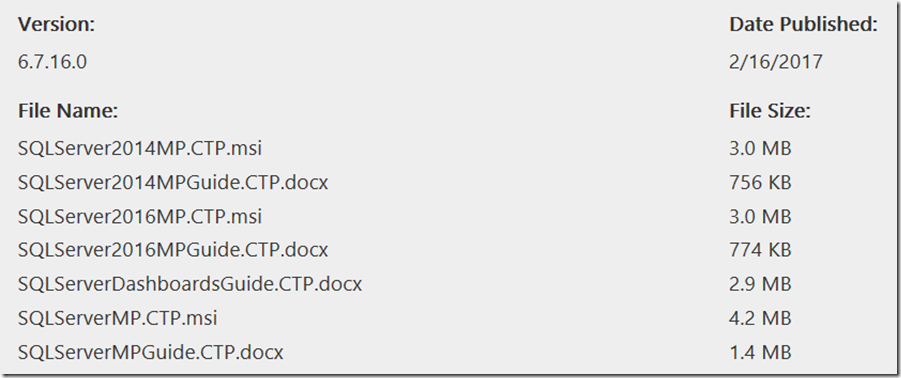
Microsoft System Center Management Packs (Community Technology Preview 1) for SQL Server
Note: There are multiple files available for this download.Once you click on the "Download" button, you will be prompted to select the files you need.
New Microsoft System Center Management Packs (Community Technology Preview 1) for the following SQL Server products:
- Microsoft SQL Server 2008/2008 R2/2012
- Microsoft SQL Server 2014/2016
Downloads available:
- Microsoft System Center Management Pack for SQL Server 2008/2008 R2/2012 (6.7.16.0)
This Management Pack provides both proactive and reactive monitoring of Microsoft SQL Server 2008, SQL Server 2008 R2 and SQL Server 2012. It monitors SQL Server components such as database engine instances, databases, and SQL Server agents. - Microsoft System Center Management Pack for SQL Server 2014 (6.7.16.0)
This Management Pack enables the monitoring of the following features:
SQL Server 2014 Database Engines (supported editions: Enterprise, Business Intelligence, Standard, Express), SQL Server 2014 Databases (including file groups, data files and transaction log files), SQL Server 2014 Agent, SQL Server 2014 Always On Availability Groups, SQL Server 2014 Failover Clusters, SQL Server 2014 Mirroring, SQL Server 2014 Memory-Optimized Data, SQL Server 2014 Managed Backup to Windows Azure, SQL Server 2014 Integration Services. - Microsoft System Center Management Pack for SQL Server 2016 (6.7.16.0)
This Management Pack enables the monitoring of the following features:
SQL Server 2016 Database Engines (supported editions: Enterprise, Business Intelligence, Standard, Express), SQL Server 2016 Databases (including file groups, data files and transaction log files), SQL Server 2016 Agent, SQL Server 2016 Always On Availability Groups, SQL Server 2016 Failover Clusters, SQL Server 2016 Mirroring, SQL Server 2016 Memory-Optimized Data, SQL Server 2016 Managed Backup to Windows Azure, SQL Server 2016 Integration Services.
The new features and fixes introduced in the version 6.7.16.0 CTP1 management packs are as follows:
New SQL Server 2008/2008 R2/2012 MP Features and Fixes- Implemented some enhancements to data source scripts
- Fixed issue: The SQL Server 2012 Database Files and Filegroups get undiscovered upon Database discovery script failure
- Fixed issue: DatabaseReplicaAlwaysOnDiscovery.ps1 connects to a cluster instance using node name instead of client access name and crashes
- Fixed issue: CPUUsagePercentDataSource.ps1 crashes with “Cannot process argument because the value of argument "obj" is null” error
- Fixed issue: Description field of custom user policy cannot be discovered
- Fixed issue: SPN Status monitor throws errors for servers not joined to the domain
- Fixed issue: SQL Server policy discovery does not ignore policies targeted to system databases in some cases
- Increased the length restriction for some policy properties in order to make them match the policy fields
- Actualized Service Pack Compliance monitor according to the latest published Service Packs for SQL Server
New SQL Server 2014/2016 MP Features and Fixes
- Implemented some enhancements to data source scripts
- Fixed issue: DatabaseReplicaAlwaysOnDiscovery.ps1 connects to a cluster instance using node name instead of client access name and crashes
- Fixed issue: CPUUsagePercentDataSource.ps1 crashes with “Cannot process argument because the value of argument "obj" is null” error
- Fixed issue: Description field of custom user policy cannot be discovered
- Fixed issue: SPN Status monitor throws errors for servers not joined to the domain
- Fixed issue: SQL Server policy discovery does not ignore policies targeted to system databases in some cases
- Fixed issue: Garbage Collection monitor gets generic PropertyBag instead of performance PropertyBag
- Increased the length restriction for some policy properties in order to make them match the policy fields
- Actualized Service Pack Compliance monitor according to the latest published Service Packs for SQL Server
For more details, please refer to the user guides that can be downloaded along with the corresponding Management Packs.
The Operations Manager team encourages you to provide any feedbacks on the management packs by sending them to sqlmpsfeedback@microsoft.com.
System RequirementsSupported Operating System
Windows Server 2008 R2, Windows Server 2012, Windows Server 2012 R2
Other Software:
- System Center Operations Manager 2012 SP1, System Center Operations Manager 2012 R2,
- For detailed instructions on setup, configuration and monitoring refer to the management pack guide.
What’s inside the Management Pack Guide?
As always read the Management Packs in full to know and understand how the Management Packs work. The Management pack Guide can change at anytime, so make sure that you have the latest. Here is some of the things that are in the Management Pack Guide at the time of this blog article.
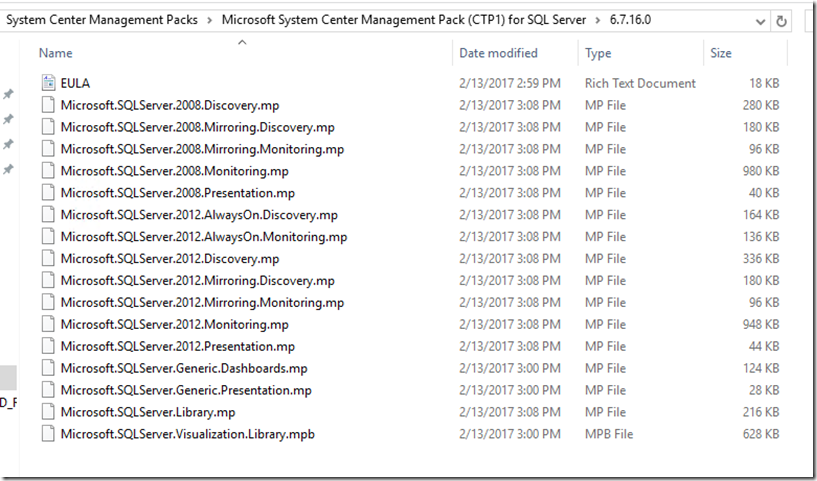
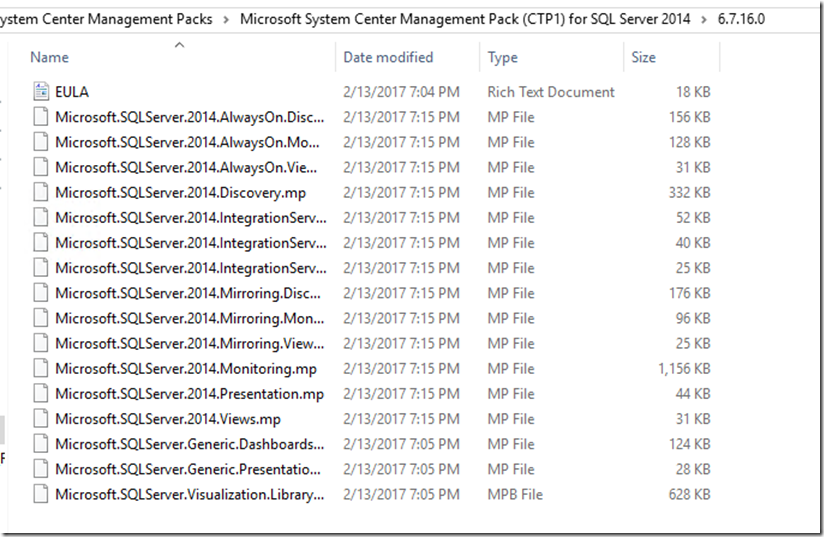
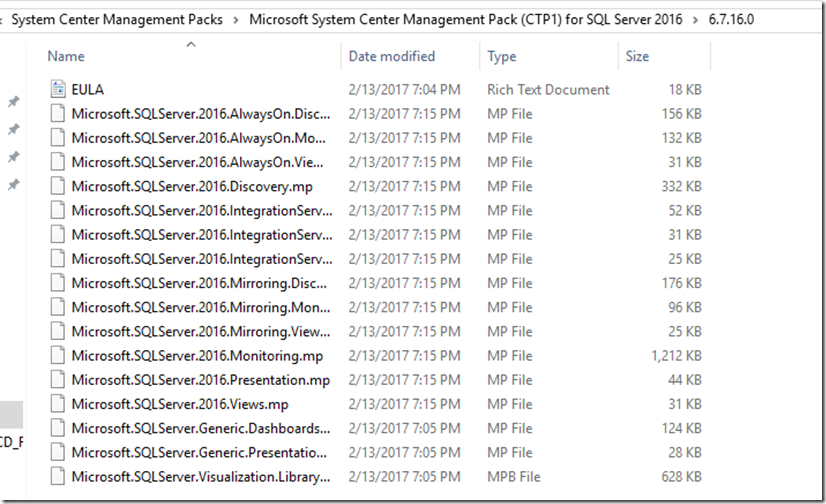
Only import what you need and required. Below is what you’ll see in each of the .MSI files.
Note: Something I noticed was that when you try to import and there is a Management Pack that has already been imported with the same version, you have to remove the duplicate management pack from the Import Management Pack window before it will allow you to install the Management Packs.
SQLServerMP.CTP.msi
SQLServer2014MP.CTP.msi
SQLServer2016MP.CTP.msi
Supported Configurations
SQL Server Management Pack is designed for the following versions of System Center Operations Manager:
· System Center Operations Manager 2007 R2 (Except Dashboards)
· System Center Operations Manager 2012 SP1
· System Center Operations Manager 2012 R2
· System Center Operations Manager 2016
The following table details the supported configurations for the management pack:
| Configuration | Support |
| SQL Server 2008SQL Server 2008 R2SQL Server 2012 | Windows Server 2008Windows Server 2008 R2Windows Server 2012Windows Server 2012 R2Windows Server 2014Windows Server 2016 (for SQL Server 2012)· 64-bit SQL Server on 64-bit OS· 32-bit SQL Server on 32-bit OSNote: 32-bit SQL Server instances are not supported on 64-bit OS |
| Clustered servers | Yes |
| Agentless monitoring | Not supported |
| Virtual environment | Yes |
For each version of SQL Server, the following editions are supported (when applied):
· Data Center
This edition is new for SQL Server 2008 R2.
· Enterprise
· Developer
· Standard
We recommend that you monitor no more than 50 databases and 150 database files per agent to avoid spikes in CPU usage that may affect the performance of the monitored computers.
Agentless monitoring is not supported. The monitoring for clustered resources is supported.
Other Requirements
To run the SQL Management Studio task and the SQL Profiler task, you must have SQL Server Management Studio and SQL Server Profiler installed on all Operations Manager computers where these tasks will be used.
If you try to run one of these tasks without the appropriate features installed, you will receive "The system cannot find the file specified" error message.
You do not need SQL Server Management Studio or SQL Server Profiler for discovery and monitoring.
As of the October 2009 release of SQL Server Management Pack package, agentless monitoring is no longer supported. This change was made to allow full support of monitoring for clustered resources.
You may need to customize your management pack. Certain accounts cannot be run in a low-privilege environment or must have minimum permissions.
The following topics are covered in this section:
· Groups
Mandatory Configuration
· Import prerequisite Management Packs.
· Enable the Agent Proxy option on all agents that are installed on servers participating in an Always On session. For instructions, see the procedure that follows this list.
Some Dashboards
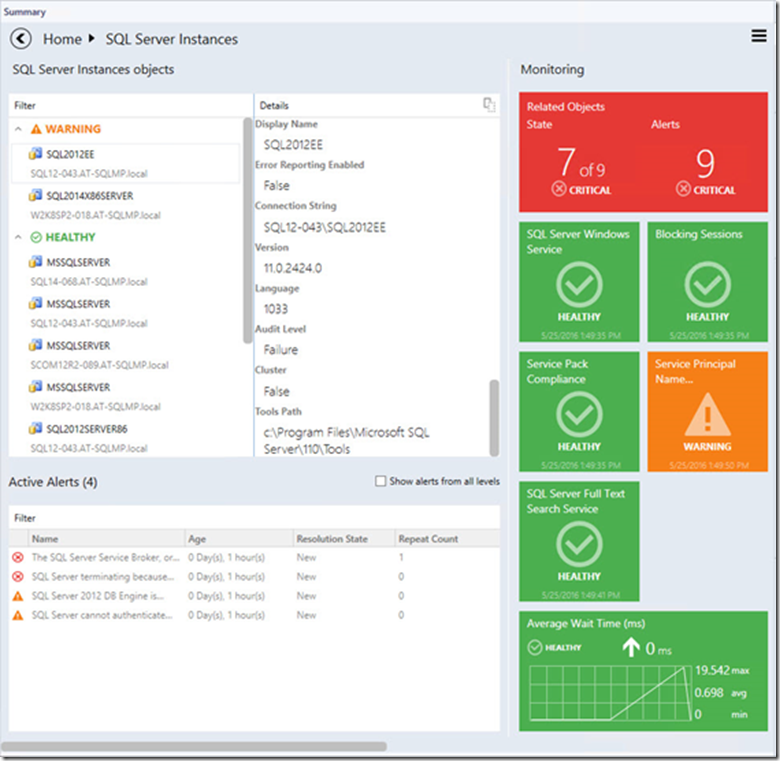
Instance View
Instance view of the Dashboard opened while drilling into a group or an object from the previous Instance view or Datacenter Dashboard is provided below:
Known Issues and Troubleshooting
Configuration of signed SQL Server Dashboards cannot be saved if Default Management Pack is removed
Issue: Signed SQL Server Dashboards store their configuration changes in Default Management Pack (Microsoft.SystemCenter.OperationsManager.DefaultUser).
Resolution: Import Default Management Pack. In further versions of the MP, it will be possible to set a custom MP to store the configuration.
SQL Server Dashboards may display obsolete data
Issue: The Operations Manager database should be synchronized with Data Warehouse. If the default synchronizing procedure has not been executed for a long period, the Dashboards become unable to get the most recent data.
Resolution: Restart System Center Data Access service and perform other required actions to reactivate Delta SynchronizationThe Operations Manager console may crash in case of SCOM server connection failure
Issue: If the Operations Manager console loses connection to SCOM server, SQL Server Dashboards may crash. It can happen due to network issues or SCOM server issues (e.g. if the console is left unattended for a long time).
Resolution: Check connection with SCOM server. Reopen the Operations Manager console.
When configuration of a SQL Server Dashboards is edited simultaneously by a few operators, the last change is applied only
Issue: When a useredits SQL Server Dashboard from the Operations Manager console and Web console simultaneously, the “Last changes apply” algorithm is implemented to resolve this situation.
Resolution: Reopen the Dashboard, or wait until the data is refreshed.
The Operations Manager console may behave unresponsive in case of a configuration save failure
Issue: In some rare cases, SCOM is unable to save updated Dashboard configuration successfully. In this case, dialogs on SQL Server Dashboards become unresponsive (e.g. OK button in “Add Group” dialog). The user can find error details in Application event log.
Resolution: Reopen the Operations Manager console.
Objects may be displayed with “Not monitored” state in case if there are 1000 objects or more
Issue: When there are 1000 objects or more discovered simultaneously (and the discovery process is not over yet), the Dashboard may be loaded correctly, but all objects will have “Not monitored” state.
Resolution: Wait until the data is refreshed.
Alerts may be displayed with “0” value in case if there are 5000 objects or more
Issue: When there are approximately 5000 objects or more discovered simultaneously (and the discovery process is not over yet), it is possible that the number of objects will be loaded and displayed correctly, but the alerts will be displayed with 0 value.
Resolution: Wait until the data is refreshed.
Silverlight version of the Operations Manager console may not receive remote changes
Issue: Any changes made in Silverlight version of the Operations Manager console from a remote workstation may not be saved.
Resolution: Reopening of the Dashboard or reloading of the console is ineffective. To apply any changes, please access the console directly.
Usage of some special Windows themes may lead to a crash of the Operations Manager console
Issue: Some changes in Windows color scheme (e.g. changing of foreground text color to another color) may lead to a crash of the Operations Manager console.
Resolution: Please use standard Windows themes and text colors.
Procedures are not deleted from data warehouse storage
Issue: The stored procedures may remain in data warehouse storage even after uninstallation of GPMP.
Resolution: After uninstallation of the manager packs, the stored procedures are to be deleted manually.
Timeouts difficulty
Issue: While working with the Dashboard (especially while processing large data volumes), a user may face a situation when the processes cannot be completed within the preset timeout.
Resolution: Timeout values for queries execution in Datawarehouse DB may be set by the user manually via the server registry. One can create “HKLM\SOFTWARE\Microsoft\Microsoft Operations Manager\3.0\Data Warehouse” key and add REG_DWORD type value with “Search Command Timeout Seconds” name. The server will use this value instead of default 180 seconds.
Certain display problems may occur while working with the groups in web version of the Operations Manager console
Issue: A problem with displaying add/delete forms may occur while using Silverlight web version of the Operations Manager console: the text of the form may be loaded earlier than the form itself, if the Dashboard contains eight or more groups.
Resolution: Unknown.
Certain problems may occur while working with some older versions of the Management Pack
Issue: The following versions of SQL Server Management Pack are considered as deprecated and suspended:
· 6.1.314.35
· 6.1.400.0
· 6.3.173.0
· 6.3.173.1
· 6.4.0.0
· 6.4.1.0
· 6.5.1.0
· 6.5.4.0
· 6.6.0.0
· 6.6.2.0
· 6.6.3.0
Resolution: Please use up-to-date versions of the Management Pack (starting from version 6.6.4.0)
Dashboards may work slowly if used rarely
Issue: When used rarely or after a long break, the dashboards may work rather slowly due to large amounts of the collected data to be processed; especially, it is related to large environments (2000+ objects).
Resolution: Below is a “warming up” script, which may be used to create an SQL job to run on some schedule. Before scheduling it as an SQL job, please test how long these queries will be executing (if you will schedule it to run too often or execution time is too long, that may kill the performance). If you have dashboards with thousands of objects to load, then time to load the content will be 10+ seconds anyway. It was tested with 600 000 objects, and the dashboard loading time was 1-2 minutes.
USE [OperationsManagerDW]
EXECUTE [sdk].[Microsoft_SQLServer_Visualization_Library_UpdateLastValues]
EXECUTE [sdk].[Microsoft_SQLServer_Visualization_Library_UpdateHierarchy]
Dashboards may crash upon upgrade
Issue: In some cases, upon upgrade of the dashboards to version 6.6.7.30 or newer, the Operations Manager console may crash with “ObjectNotFoundException” error.
Resolution: Wait until the importing process is completed, and restart the Operations Manager console. Mind that the Operations Manager console restarting is essential after upgrade of the dashboards. Otherwise, the dashboards will not work.
Colors in Microsoft Silverlight may be assigned incorrectly
Issue: ComboBox colors and main ScrollViewer background may be displayed incorrectly, especially in the dark theme.
Resolution: Unknown.
Certain issues may appear during rapid changes performed in Datacenter view
Issue: If user rapidly changes datacenter dashboard views while the loader is displayed, the last selected view can still be opened, but the queries of the previously closed views will not be cancelled.
Resolution: Unknown.
Dashboards may get stuck while loading
Issue: When there are more than 50K objects on a Dashboard monitored by multi-instance performance collection rules, Datawarehouse DB statistics may get broken, and the Dashboard loading time could get much longer than usual. Moreover, extensive TempDB and Log space usage (~2-5 GB) can be noticed.
Resolution: Wait for some time until the Dashboard is loaded, then run sp_updatestats stored procedure in Datawarehouse DB.
Outdated group names may be displayed in the Instance view
Issue: If a group is renamed, or any already renamed groups are present in SCOM, the old group names may be displayed in SQL Server Dashboards Instance view. In addition, if some groups are renamed in SCOM after importing the dashboards, their old names may be still displayed in the Instance view.
Resolution: Unknown.
Limited access role users may not see SQL instances on SQL Server Roles dashboard
Issue: If a user is assigned to a limited access role (e.g. with access to SSAS Instance group, SSRS Instance Group, and SQL Server DB Engine Group only), no SQL instances are visible on SQL Server Roles dashboard.
Resolution: As long as SQL Server Roles dashboard is currently based on Server Roles Group, the user should obtain access to "Server Roles Group" to make SQL instances visible on the dashboard.
Datacenter view dashboard refresh animation is not displayed
Issue: When the Datacenter view dashboard is refreshed by means of the corresponding button in the hamburger drop-down menu, no refresh animation is displayed.
Resolution: Unknown.

