How to train your MAML – Looking at the data in SQL Azure
In my last post we saw how to clean, transform and join datasets. I also mentioned I had trouble doing the join at all and even now it’s not quite right so how can we look at the data and find out what’s going on. The visualisation option only shows a few rows of the 2 million in the dataset and there’s not really anything in ML Studio to help. However we can export the data in a number of ways, to Azure storage either as a table or blob or directly into SQL Azure. The latter seems more useful as we need to investigate what’s going on when the data is joined, however a little bit of pre-work is required as ML studio won’t create the tables for us – we’ll have to do that ourselves. We also don’t need all the data just a consistent set to work on so let’s start by understanding the split module in ML studio, which we’ll need later on to train our experiment.
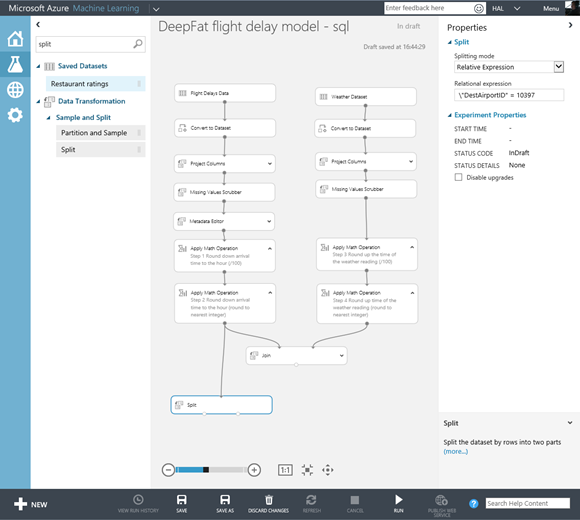
Search for the Split module in MLStudio and drag it onto the design surface, connect it the last Apply Math Operation in the flight delay data set process and set the split properties as shown..
What the split does is to send the filtered data that meets our criteria to the result dataset1 (on the left) and the data that doesn’t to the result set on the right (result dataset 2). as well see later normally we would use this to randomly split out some of the data at random but in this case we are using a relative expression - \"DestAirportID" > 11432 & <11434 ( I did try \"DestAirportID" = 11433 but I got an error!) to just give us the flights arriving at one airport. If we run the model now we can visualise the data in the left output the split module we’ll just one value (1433).
| Note when we rerun experiment only the bits that have changed and what they affect are actually run – in this case only the split itself is being run the rest is being read form cache (in the storage account) |
Now we need somewhere to put the data which in this case will be SQL Azure. As with MAML everything can be done from the browser.
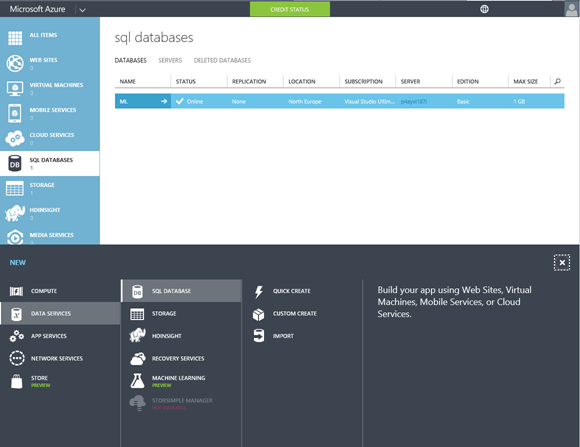
Go to the Azure management portal and select the SQL Databases option and at the bottom of the screen click on the plus to create a new database with quick create. Mines in northern Europe, it’s basic with no replication and is 1Gb (you won’t need that much)..
You will also be prompted for an administrator ID and password. Once the database is created we now need to ensure it remotely and so we need to open up the firewall much as we would do if the database was on any remote server in our data centre. To this in SQL Azure click on the configure option ..
You will see your current ip address here which you can then use to make a rule (I have hidden mine in the screen shot above) . Now we can go back to the dashboard and click on the hyperlink to design or run queries against our new database from the SQL management portal (you’ll be asked to login first). Now we can add in a table for our flight delay data as ML studio won’t do that for us. We need it to have the right data types and rather than you doing it manually here is the query you can run to create it.
USE ML
CREATE TABLE [dbo].[FlightDelay] (
[ID] INT IDENTITY (1, 1) NOT NULL,
[Month] INT NOT NULL,
[DayofMonth] INT NOT NULL,
[Carrier] NVARCHAR (5) NOT NULL,
[OriginAirportID] INT NOT NULL,
[DestAirportID] INT NULL,
[DepDelay] INT NULL,
[CRSArrTime] INT NULL,
[ArrDel15] INT NULL,
);
CREATE CLUSTERED INDEX [IX_FlightDelay_0]
ON [dbo].[FlightDelay]([ID] ASC);
Notice that there is a separate ID column with the identity type so that we have a primary key for each row.
Now we can see how to export data to SQL Azure from ML studio. Drag the Data Writer model onto the design surface and connect it to the left hand output of the split module..
Set the module properties as follows;
- Data destination: SQL Azure
- Database server name: your database server name
- Database name ML (in my case)
- Server account name and password to match the admin account and password you setup for your database.
- Check accept any server certificate
- Coma separated list of columns to be saved: Month,DayofMonth,Carrier,OriginAirportID,DestAirportID,CRSArrTime,DepDelay,ArrDel15
- Data table name Flight Delay
- Comma separated list of datatable columns: Month,DayofMonth,Carrier,OriginAirportID,DestAirportID,CRSArrTime,DepDelay,ArrDel15
- Number of rows to be written per SQL Azure operation: 50 (the default)
Note the columns names above are case sensitive and the number of columns input and output must be the same. Also be aware if you run the experiment again you’ll add more rows to he SQL tables each time so remember to empty the table before a run – truncate table FlightDelay; truncate table AirportWeather |
If we run the experiment now we will populate the FlightDelay table in SQL azure and each rerun will truncate the table and repopulate this (I couldn’t see how to override this). Once that’s working OK we can then repeat the exercise for the weather data:
- In the SQL Azure management portal create a new table AirportWeather
USE [ML]
CREATE TABLE [dbo].[AirportWeather] (
[ID] INT IDENTITY (1, 1) NOT NULL,
[AirportID] INT NULL,
[Month] INT NULL,
[Day] INT NULL,
[Time] INT NULL,
[TimeZone] INT NULL,
[Visibility] INT NULL,
[DryBulbCelsius] INT NULL,
[WetBulbCelsius] INT NULL,
[DewPointCelsius] INT NULL,
[RelativeHumidity] INT NULL,
[WindSpeed] INT NULL
);
CREATE CLUSTERED INDEX [IX_AirportWeather_0]
ON [dbo].[AirportWeather]([ID] ASC);
- Copy and past the existing Split module and connect it to the last Output Math Operation for weather data process and change the relative expression to \"AirportID" > 11432 & <11434
- Copy and paste the existing write module and connect it to the new Split module for the weather data. Change the two setting for the columns to be used to AirportID,Month,Day,Time,TimeZone,Visibility,DryBulbCelsius,WetBulbCelsius,DewPointCelsius,RelativeHumidity,WindSpeed
Now we’ll leave ML Studio and look at what we have in the SQL Azure portal. Click on new query and paste following in..
Select F.Month, F.DayofMonth, F.CRSArrTime, F.DestAirportID, F.CRSArrTime, F.DepDelay, F.OriginAirportID, A.DewPointCelsius, A.DryBulbCelsius, A.RelativeHumidity, A.Visibility, A.WetBulbCelsius, A.WindSpeed
from FlightDelay F
inner join AirportWeather A
on F.DestAirportID = A.AirportID and F.Month = A.Month and F.DayofMonth = A.Day
and F.CRSArrTime = A.Time
order by
F.Month, F.DayofMonth, F.CRSArrTime
and notice that we get back 61,231 rows compared to the row count of 62,211 for the FlightDelay table which means we are losing 980 rows of data. 887 rows of this are down to the fact that there are no rows in the weather data for 0 (midnight) but there are in the flight data (midnight in the weather data shows as 24). So something is wrong with the mechanism for matching the flight arrival time with the nearest timed weather reading. This was not a deliberate error on my part I just based this all on the example in ML studio but it does show two things:
- Always check your findings – in this case the wrong weather data was being used which will affect the accuracy of our predictions
- Don’t blindly trust someone elses work!
Anyway in this case it’s easy to fix. all we need to do is to subtract one hour from the weather reading data by adding in another Apply Maths Operation Module as show below..
if we run our query in SQL Azure again we will get back 62159 rows which means we are missing a few rows of weather data and so certain flights will are being dropped when we do the join. If we were to use this in BI then we would need to fix this but what we need for machine learning is clean data and now we have made this fix we have a good set of data on which to make predictions and that's what we will start to look at in my next post.


