Lab 18: Debugging a handled and unhandled exception
This article has been moved to its new home here: https://benperk.github.io/msdn/2016/2016-IISLAB-lab-18-debugging-a-handled-and-unhandled-exception.html
In this lab you will use procdump to view exceptions and capture a memory dump when an exception happens.
Setup
- Install Debugging Tools for Windows – For WinDbg
- Install and Configure CSharpGuitarBugs on an IIS server as described in Lab 1
- Place PROCDUMP executable on the IIS Server
- Read this article here about the –f parameter
Lab 18.1 – Handled Exception
1. Access the CSharpGuitarBugs website so that a W3WP process has been instantized.
2. Open Task Manager and find the PID for the web site, something similar to that shown in Figure 1.
Figure 1, find the PID of a W3WP.exe process
3. Open a CMD prompt and navigate to the location where you copied procdump to.
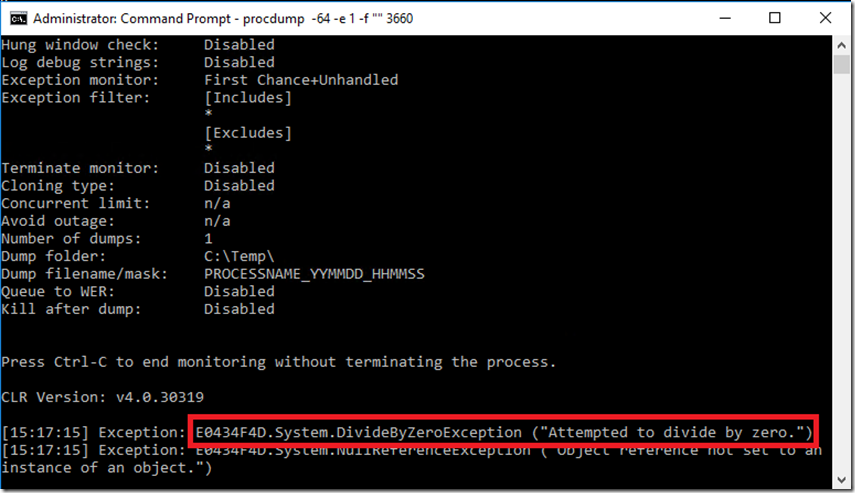
4. Enter and execute the following command, as seen in Figure 2.
procdump -64 -e 1 -f "" 3660
Figure 2, execute procdump to watch for exceptions
5. While the command is running, click on the FAQ link in the Forums section, you should the exceptions, similar to that show in Figure 3.
Figure 3, execute procdump to watch for exceptions
6. Prepare procdump to capture a memory dump when the System.DivideByZeroException happens by executing this command, shown in Figure 4.
procdump -64 -e 1 -f "DivideByZero" 3660
Figure 4, execute procdump to capture a memory dump for a specific exception
7. Reproduce the exception by pressing F5 of navigating back to the main page and clicking on the FAQ link in the Forums section. You should see something similar to that shown in Figure 5.
Figure 5, execute procdump to capture a memory dump for a specific exception, memory dump captures
8. Open the memory dump in WinDbg and execute !mex.dae and !mex.clrstack2, note that in Figure 4, I incorrectly left out the –ma parameter which resulted in a mini memory dump being taken instead of a full dump. Take another shot at capturing the memory dump, but this time include the –ma as seen below.
procdump -64 -ma -e 1 -f "DivideByZero" 3660
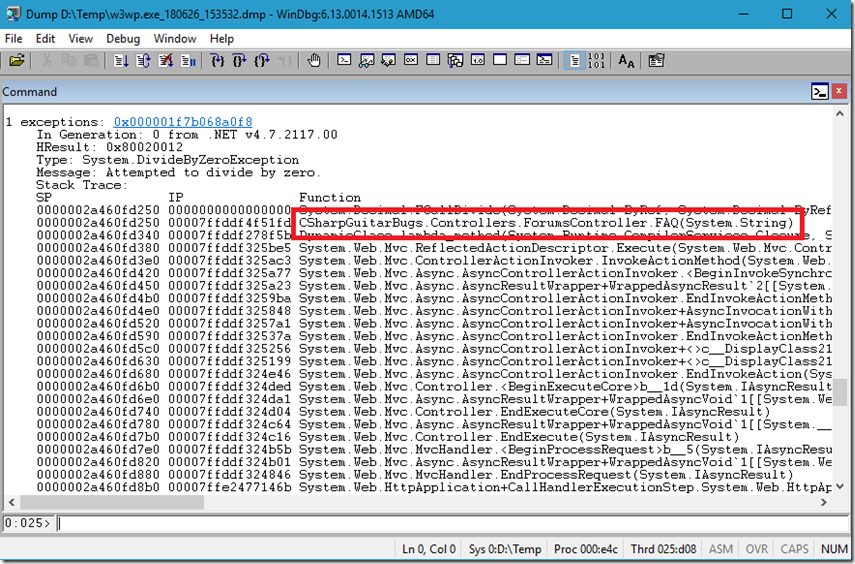
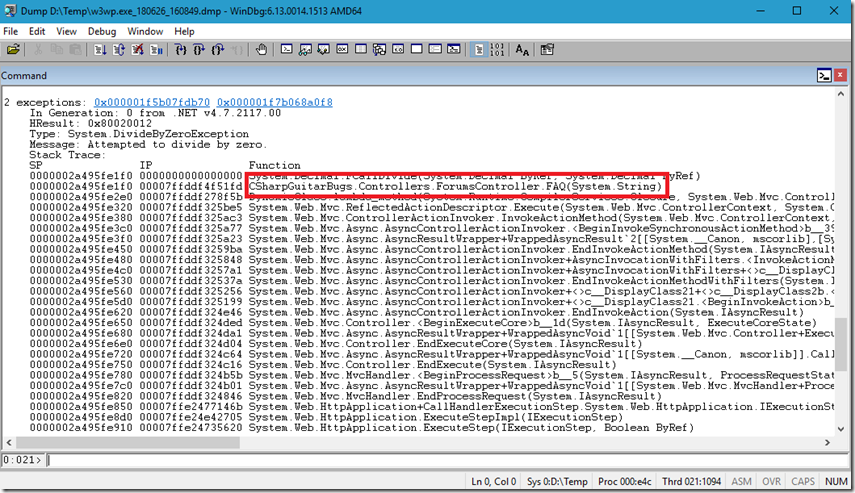
Compare the output of each of the dumps and compare the differences when you execute mex.dae (dump all exceptions), as seen fin Figure 6.
Figure 6, WinDbg dump all exceptions within a full memory dump
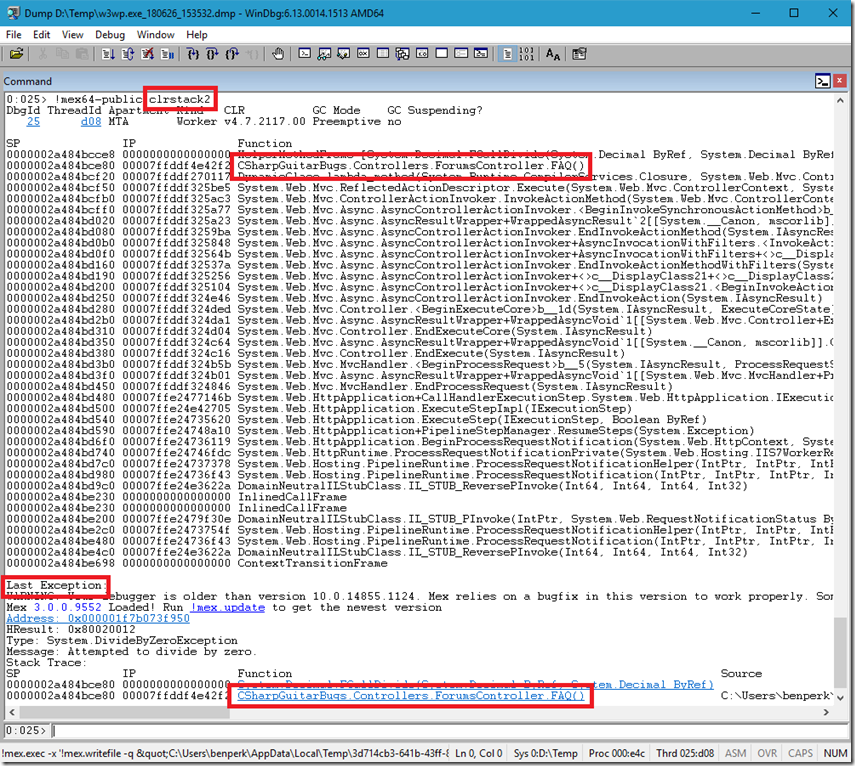
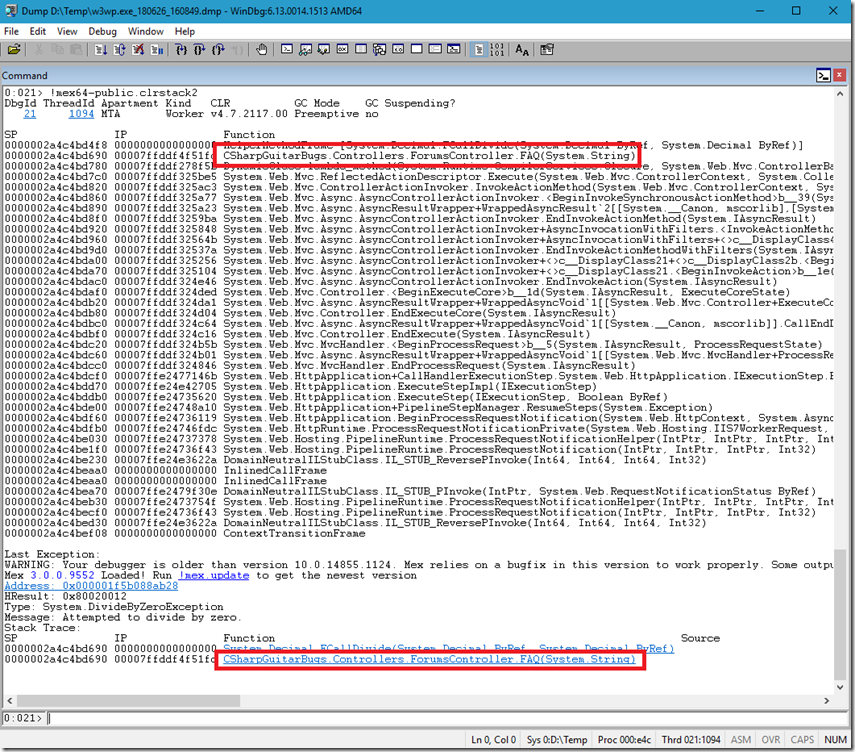
And the output of mex.clrstack2, as seen in Figure 7.
Figure 7, WinDbg clrstack within a full memory dump
You typically find the exception is thrown by the method at or near the top of the stack. Give that exception and the method that triggers the exception to the developer who wrote the code and ask for it to be fixed!
Lab 18.2 – Unhandled Exception
1. Access the CSharpGuitarBugs website so that a W3WP process has been instantized.
2. Open Task Manager and find the PID for the web site, something similar to that shown in Figure 1.
3. Open a CMD prompt and navigate to the location where you copied procdump to.
4. Enter and execute the following command, as seen in Figure 8.
procdump -64 -e 1 -f "" 3660
Figure 8, execute procdump to watch for exceptions
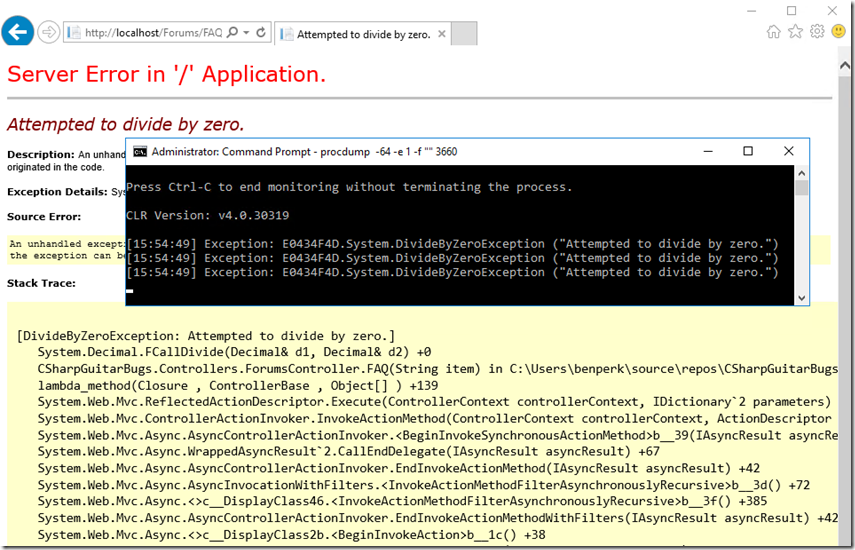
5. After clicking the FAQ link from the main page, you again will see the DivideByZero exception, that was the handled exception which ran within a try{}…catch{} block. This time, click on the “Report this Exception” button which will trigger an unhandled exception. When testing this on an IIS server, you will get the YSOD (Yellow Screen of Death), as seen in Figure 9.
Figure 9, execute procdump to watch for exceptions
This is because it is being run on the server the customErrors is not Off. To see how it would look in the live site, check it out here. Not so intuitive huh?
6. Execute the following command to capture a memory dump when the unhandled exception is triggered. It is the same as the handled one, so already be on the FAQ page before running the command. Once you run the command, click on the “Report this exception”. Also remember to include the –ma parameter so you get a full memory dump. See Figure 10.
procdump -64 -ma -e 1 -f "DivideByZero" 3660
7. The capture of the unhandled exception, looks similar to the handled, Figure 11.
Figure 11, execute procdump to capture a memory dump for a specific exception, memory dump captures
8. Let’s open this memory dump in WinDbg and see what it looks like. Execute !mex.dae and !mex.clrstack2 and see if there are any differences, see if you can view the code to determine for yourself the difference between a handled and unhandled exception, even though I already mentioned that previously. Dump all exceptions is displayed in Figure 12.
Figure 12, WinDbg dump all exceptions within a full memory dump
9. No significant difference there, in Figure 12, let’s look at the mex.clrstack2 output, Figure 13.
Figure 13, WinDbg clrstack within a full memory dump
No difference there either, so apparently the stack and exception look the same using mex regardless of handled or unhandled. However, how they look to the client consumer is very different. You did get pretty far in finding what the reason for the exception is. You can view the code here and see the difference between the FAQ() and the FAQ(string) method.


