Operationalizing Twitter’s Anomaly Detection in AzureML
While researching on Time Series-based Anomaly Detection algorithms, I came across Twitter’s blog post on their implementation of Anomaly Detection, and also its associated source code on GitHub. Only one word popped into my mind – BRILLIANT! Now, I don’t have to write my own algorithm. On the other hand, I also wanted to test AzureML’s Custom R module feature and therefore thought of converting this magnificent piece of code into an operationalized web service using AzureML. In this article, I will show you how easy it is to package a custom R function into an operationalized web service in the cloud.
Understanding Anomaly Detection
Let’s say you have a daily routine, you Wake up at 7:00am, Breakfast at 8:00am, Start work 9:00am, Lunch 1:00pm, Stop work 6:00pm., and Reach home 7:00pm You have been doing this for 5 years happily and your boss is also happy with your work. But, for a couple of days, you reach the office at 11:00am instead of 9:00am. Your boss and colleagues immediately ask you, “Is there anything wrong?”. These two days are anomalies in your routine and human brain is trained to detect these anomalies because we don’t like them. Human brains are trained to normalize on patterns and let the routine ride your life.
Anomalies are everywhere, at work, at home, in industries, in your health, stock market, and also in computer systems. In cloud infrastructure, where every system is desired to have a consistent and predictable state, anomalies are like cancer. If you don’t detect them early on, they can spread and bring down your entire infrastructure. Usually, anomalies are associated with time-series (though not required) because we live in a time continuum and it is easier to map changes in values with time. Whether it is your heart beat or memory usage of a server, mapping it to a time series will help you visualize and detect anomalies as they relate to time.
Below are some examples of anomalies detected using Twitter’s Anomaly Detection algorithm web service running in AzureML.
To understand how Twitter’s Anomaly algorithm works, please read this. If you want to run the R packages locally, I suggest you follow the instructions on Twitter’s blog. The procedure I followed was:
- Read Twitter’s blog and studied how the algorithm works
- Ran the R module locally in R studio
- Packaged the R module using AzureML studio
- Created an experiment
- Published it as a web service
- Created a C# client application to test the web service
Testing Twitter’s Code in AzureML
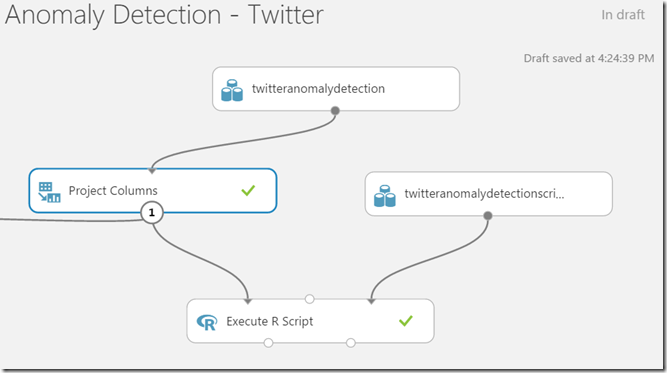
In AzureML, there is an Execute R Script module that lets you run a custom R script on an input data. For more information on how to get started with this module, please refer to this article.Next, I uploaded the sample data, zipped and uploaded Twitter’s R code and got the following experiment working in AzureML in no time.
I used the Project Columns module to project only the timestamp and count columns from the dataset to the R script because for anomaly detection, I only need timestamps and values for detecting anomalies.
Next, I modified the Execute R Script module script with the following code
# Map 1-based optional input ports to variables
raw_data <- maml.mapInputPort(1) # class: data.frame
# Contents of optional Zip port are in ./src/
source("src/date_utils.R");
source("src/detect_anoms.R");
source("src/plot_utils.R");
source("src/ts_anom_detection.R");
#Convert the first column to POSIXlt timestamp.
raw_data[[1]] <- as.POSIXlt(raw_data[[1]])
#Call Twitter’s R module function (from uploaded script)
res = AnomalyDetectionTs(raw_data, max_anoms=0.02, direction='both', plot=TRUE)
res$anoms[[1]] <- as.character(res$anoms[[1]], format="%Y-%m-%dT%I:%M:%S %Z")
resdf <- res$anoms
maml.mapOutputPort("resdf");
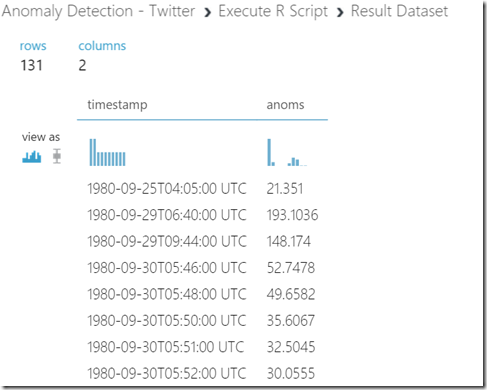
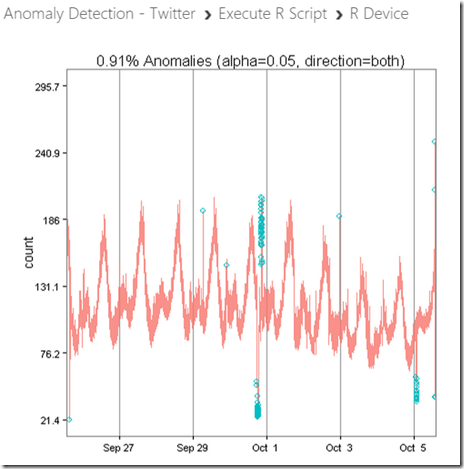
The script above acts as a wrapper over the Twitter’s AnomalyDetectionTs function. Notice how I am importing the dependent R files, modifying the time to POSIXlt format and then calling the AnomalyDetectionTs function from the ts_anom_detection.R file directly. Once you import the R files, functions from these files are available directly in the Execute R Script module. Once the anomalies are detected, I output the anomalies object (i.e. anoms) to the data output port (Port #1 – bottom left) . If you set plot=TRUE in the function, the plot get automatically output to the R Device port(Port #2 – bottom right). If you visualize both the ports, you will observe the following results (131 anomalies detected)
The blue dots represent the anomalies in the data. I could have been contented here and published the experiment as a web service. So, what was the problem?
I wouldn’t be able to expose all the parameters of the AnomalyDetectionTs() function as web service inputs. So, to do real justice to this fantastic algorithm, I decided to drive a bit further and create a custom R module in AzureML for this function.
Creating Custom R Module
Creating a custom R module in AzureML is not difficult as long as you understand the original R module that you want to wrap and how to create XML files. For more information on creating custom R modules, please visit this page.
For the AnomalyDetectionTs() function, I creates a new R file containing a wrapper function as shown below.
AnomalyDetectionTsw <- function(dataset1, max_anoms = 0.10, direction = 'pos',
alpha = 0.05, only_last = NULL, threshold = 'None',
e_value = FALSE, longterm = FALSE, piecewise_median_period_weeks = 2, plot = FALSE, y_log = FALSE, xlabel = '', ylabel = 'count', title = NULL, verbose=FALSE, narm = FALSE) {
#Added by Tejaswi. Wrapper to work with AzureML
# Contents of optional Zip port are in ./src/
source("src/date_utils.R");
source("src/detect_anoms.R");
source("src/plot_utils.R");
source("src/vec_anom_detection.R");
source("src/ts_anom_detection.R");
if(only_last == "None"){ only_last <- NULL}
if(xlabel == "None") { xlabel <- ''}
dataset1[[1]] <- as.POSIXlt(dataset1[[1]])
res <- AnomalyDetectionTs(dataset1, max_anoms, direction,
alpha, only_last, threshold,
e_value, longterm, piecewise_median_period_weeks, plot,
y_log, xlabel, ylabel,
title, verbose, narm)
res$anoms[[1]] <- as.character(res$anoms[[1]], format="%Y-%m-%dT%I:%M:%S %Z")
if(plot == TRUE){
print(res$plot)
}
return(res$anoms)
}
Observe the similarity between the Execute R script and the new R module above. With this R module, I can now load the dependent modules, call the AnomalyDetectionTs() function, and most importantly expose the function parameters as web service parameters. The definition of input parameters and entry point of the module is defined in an XML file. Next, create the XML file for the wrapper module as shown here.
You can find the final wrapper source code and the XML file I created here.
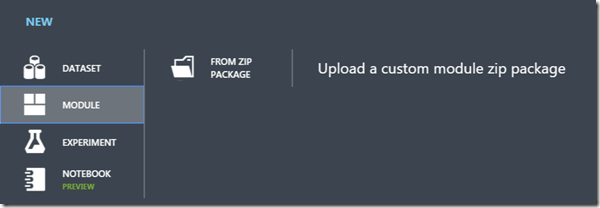
Now zip-up the original content (all Twitter modules), the wrapper module, and the xml file into one zip file and upload it as a module in AzureML Studio.
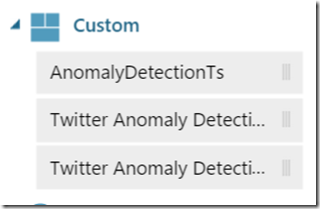
After processing and validating, the custom module should show up in the Custom section of the Toolbox of the AzureML Studio
Testing the R Module
Now you have your own Anomaly Detection module you can use in any experiment. Isn’t that cool? You can use and test the module like any other module in AzureML Studio.
If you test the module with the original dataset, it should yield the exact same results as before (131 anomalies). Note that we are not changing any algorithm logic, merely wrapping it into a reusable module.
Publishing Web Service
Now, you can create a web service and publish it that any client app can call. A couple of things to keep in mind:
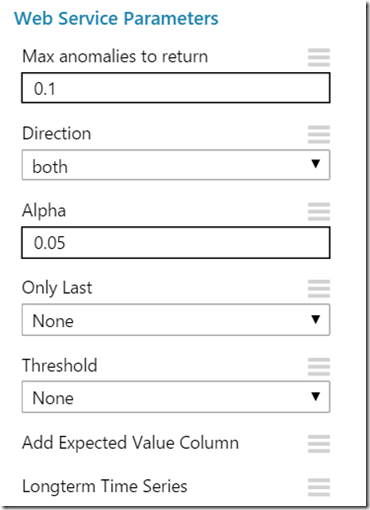
1) Select the web service parameters you want to expose from the properties pane of the custom module. These parameters are defined in the XML file of the module.
2) Provide default values for the appropriate parameters
3) Make sure you have one input and two Web Service outputs (not required) so that you can send even the plot all the way to the end user.
The Client Application
Finally, we will need a client application to consume the web service. I have already built one for you, so relax. Please download the source code for the C# client console application from here. Before running the application, please update the AnomalyClient.exe.config file with the Url and Access Key of your AzureML web service.
<add key="AnomalyDetectionWebServiceUrl" value="" />
<add key="AnomalyDetectionApiKey" value="" />
To display the application parameters/switches, type the following on the command prompt.
>AnomalyClient.exe --help
You may also run the runtests.cmd file from the command prompt to execute a few tests. The anomalies are created as [GUID].csv files and plots are created as [GUID]-n.png; where [GUID] is a random GUID and n is the count of graphic (currently only 1). The logs will be available in the output.log file.
Note: The application lets you input a CSV file as an input with two columns “timestamp”, “values”. Timestamp must be the first column and Values must be the second column. If you have it reversed, it won’t work. If you don’t specify any input file, the application will generate random data.
The application should work with or without headers in the CSV file. Use it at your own risk, but enjoy it thoroughly!
Thank you!
Tejaswi
References
Twitter’s Anomaly Detection Algorithm
Twitter’s Anomaly Detection GitHub Repository
Anomaly Detection with Twitter in R


