SQL Nuggets
It’s been a while since my last entry for Technet Insiders, one reason for the delay is that I’ve been very busy writing and presenting at SQL Server User Groups and organising our forth SQLBits Community Conference on March 28th at the Manchester Metropolitan University.
Anyone who has been to a SQL Server User Group meeting will hopefully understand what a SQL Nugget is; for those of you who haven’t my own description of one is a “Something short and interesting regarding SQL Server, the sort of thing that makes you think, “Wow I didn’t know that!”” Having a SQL Nugget slot at the SQL Server User Group meetings works very well, not only does it give the presenters a bit of a break; it also increases the interaction between the attendees, which leads what I think is a very enjoyable atmosphere.
You don’t have to be a seasoned presenter to give a Nugget and quite often it is advantageous to be quite the opposite. For example this is a nugget I picked up at the Leeds Area meeting the other week:
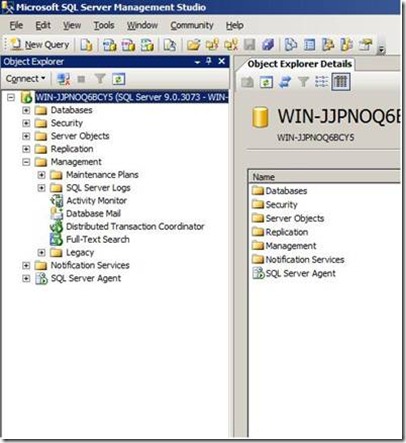
I tend to have my own processes when trying to diagnose problems, and having grown up through what is now quite a few versions of SQL Server, I still tend to use the same or modified versions of scripts I’ve had for a few years, rather than the GUI side of Management Studio. But that’s me being stuck in my old ways; if you have a problem with your system Activity Monitor is a good place to start. In SQL Server 2005 I knew that I could find it on the Management menu
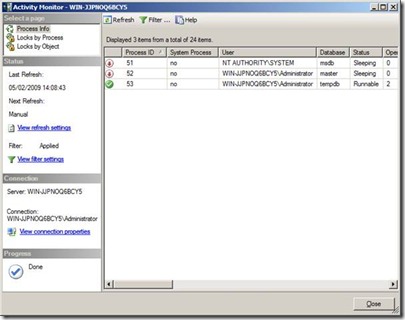
If you double clicked on this you would get a screen like:
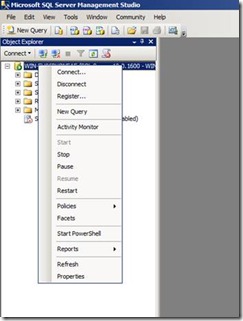
In SQL Server 2008, this has now moved. It can be found by right clicking the instance name in Object Explorer; there you will see Activity Monitor on the menu. There is also a button on the standard tool bar for it.
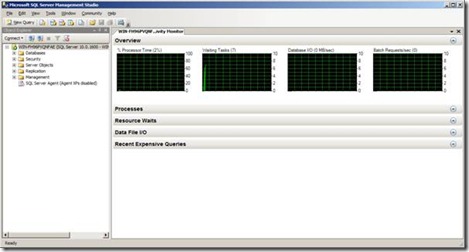
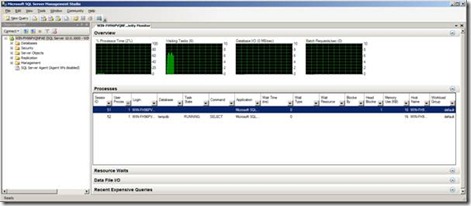
If you click on the Activity Monitor menu option you will see a screen like the following:
Now you may be thinking the fact that Activity Monitor had moved was interesting enough to be a nugget, but it gets better!
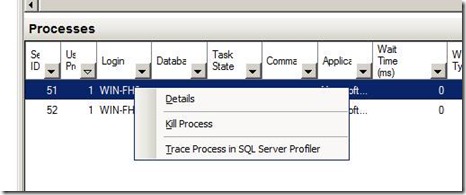
Not only do you have a nice graphical display that shows the percent of processor time, number of waiting tasks, database I/O and batch requests; if you display the processes by clicking on the  button on the right hand side you get a list similar to the one in SQL Server 2005. Right Clicking on one of the listed processes, gives you the option to Trace the process in SQL Profiler
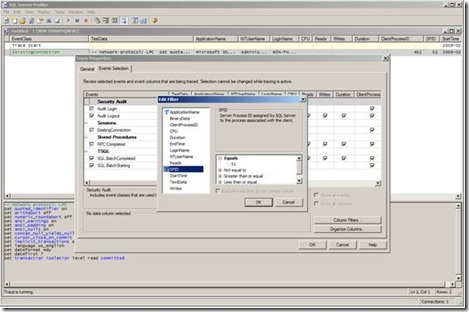
This will start SQL Profiler with a filter on the given SPID, something I thought was really useful and very interesting.
With SQL Server you always seem to be learning something new, even if it is a small nugget like this. It’s finding out things like this which continue to makes one’s job fresh and pleasing. The SQLBits committee like Nuggets so much, we have decided to run a competition for delegates at SQLBits IV and challenge them to bring along their own nugget and have it recorded for the SQLBits website. After the conference we will vote for the best nugget and the winner will get a prize of an X-Box. This was kindly donated by the Manchester Area SQL Server User Group, which sort of closes the circle and brings us right back to the beginning again!
Comments
- Anonymous
January 01, 2003
Martin Bell MVP and SQL Bits Organiser, wants to promote the idea of SQL Nuggets.  Basically these
