Configuring DebugDiag to Automatically Capture a Full User Dump on a Managed Function
I recently worked an issue with a customer where we needed to capture a full user dump of the IIS worker process when a specific function was being called. The problem was that the function was in managed code. I thought it would be good to share how to do this with the Web Topics Community. I will first show how to set a managed breakpoint in a normal debugger. Then I will show how to automate it with DebugDiag, and have it take an action of creating a full user mode dump file when the breakpoint is hit.
The managed function I will use to illustrate this is:
System.Web.HttpResponse.ReportRuntimeError
Normal Debugger
Load sos.dll:
.loadby sos mscorwks
Method 1: Set the Breakpoint with !bpmd
0:012> !bpmd System_Web_ni System.Web.HttpResponse.ReportRuntimeError
Found 1 methods...
MethodDesc = 65f688bc
Setting breakpoint: bp 660A27C0 [System.Web.HttpResponse.ReportRuntimeError(System.Exception, Boolean, Boolean)]
Method 2: Find the Jitted address and set with bp command
0:012> !name2ee System_Web_ni System.Web.HttpResponse.ReportRuntimeError
Module: 65f21000 (System.Web.dll)
Token: 0x060005fb
MethodDesc: 65f688bc
Name: System.Web.HttpResponse.ReportRuntimeError(System.Exception, Boolean, Boolean)
JITTED Code Address: 660a27c0
0:012> bp 660a27c0
When you run the debugger, and it breaks, you can use !clrstack to see the call stack:
0:003> !clrstack
OS Thread Id: 0x68c (3)
ESP EIP
0063f2f0 660a27c0 System.Web.HttpResponse.ReportRuntimeError(System.Exception, Boolean, Boolean)
0063f2fc 66090280 System.Web.HttpRuntime.FinishRequest(System.Web.HttpWorkerRequest, System.Web.HttpContext, System.Exception)
0063f344 660900d6 System.Web.HttpRuntime.OnHandlerCompletion(System.IAsyncResult)
0063f374 6608fafe System.Web.HttpAsyncResult.Complete(Boolean, System.Object, System.Exception, System.Web.RequestNotificationStatus)
0063f394 6608c6e1 System.Web.HttpApplication+ApplicationStepManager.ResumeSteps(System.Exception)
0063f3e4 660808ac System.Web.HttpApplication.System.Web.IHttpAsyncHandler.BeginProcessRequest(System.Web.HttpContext, System.AsyncCallback, System.Object)
0063f400 66083e1c System.Web.HttpRuntime.ProcessRequestInternal(System.Web.HttpWorkerRequest)
0063f434 66083ac3 System.Web.HttpRuntime.ProcessRequestNoDemand(System.Web.HttpWorkerRequest)
0063f444 66082c5c System.Web.Hosting.ISAPIRuntime.ProcessRequest(IntPtr, Int32)
0063f658 79f68cde [ContextTransitionFrame: 0063f658]
0063f68c 79f68cde [GCFrame: 0063f68c]
0063f7e8 79f68cde [ComMethodFrame: 0063f7e8]
This can be useful when a particular runtime error is occurring in ASP.NET and you are not sure why. However, attaching a live debugger and running these commands will stop the processing of web requests for the amount of time you spend in the live debugger. Therefore, the following steps will show how to automate this with DebugDiag.
Automating a Managed Breakpoint Dump with DebugDiag
DebugDiag can be downloaded here: https://www.microsoft.com/downloads/details.aspx?FamilyID=28bd5941-c458-46f1-b24d-f60151d875a3&displaylang=en
After Installing DebugDiag, the steps we will take are as follows:
- Create a Crash Rule, but do not activate it.
- Modify the Crash Rule Script
- Activate the Crash Rule
Create a Crash Rule that is not activated
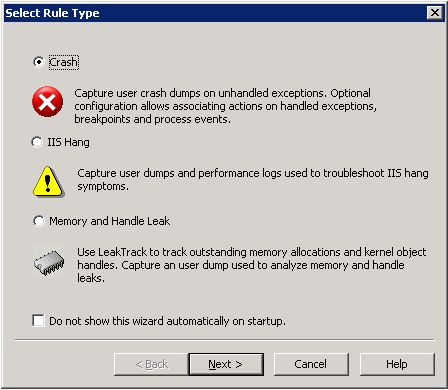
On the rules tab click the Add Rule... button to bring up the Rule creation wizard.
Choose the Crash Rule Option:
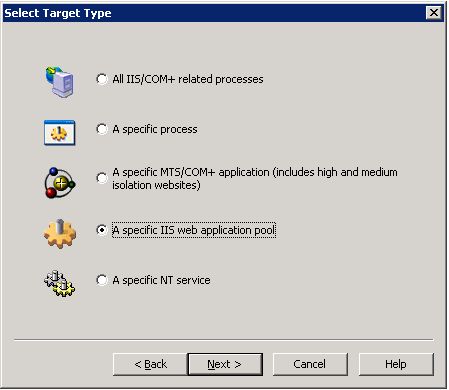
Choose the option "A specific IIS web application pool"
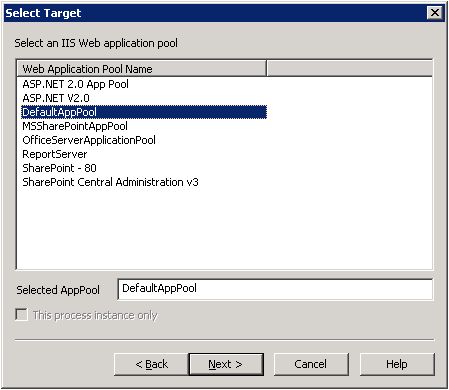
Choose the application pool that will be monitored
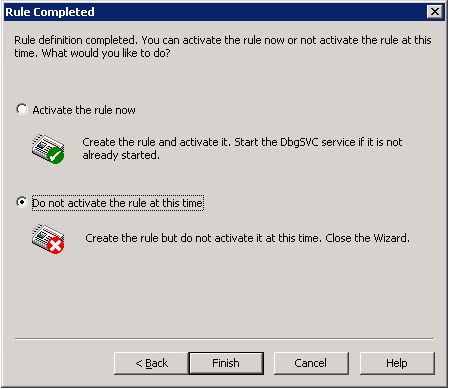
Click next twice to move to the end of the Wizard and choose "Do not activate the rule at this time"
Click Finish to create the rule
Modify the Crash Rule Script
The crash rule is a VBS File that will be located in the DebugDiag installation Scripts sub-directory. The VBS File is used when DebugDiag attaches to the IIS worker process for debugging. We will be modifying two functions in this script file.
Open the script file in notepad or your favorite text editor. It will be named CrashRule_WebAppPool_AppPoolName.vbs. Where the "AppPoolName" part of the file will be the name of the application pool the rule was configured for. Search for Debugger_OnInitialBreakpoint in the script file. This is a function that is called when DebugDiag first attaches to the process. This is where we will add code to set the breakpoint. The function should look like this when completed.
Sub Debugger_OnInitialBreakpoint()
Dim strRet, strBP, bpCommand
WriteToLog "Initializing control script"
On Error Resume Next
Set ServiceController = CreateObject("DbgSVC.Controller")
Set ServiceState = ServiceController.ServiceState
On Error Goto 0 WriteToLog "Clearing any existing breakpoints"
WriteToLog Debugger.Execute("bc *")
WriteToLog Debugger.Execute(".loadby sos mscorwks")
strRet = Debugger.Execute("!bpmd System_Web_ni System.Web.HttpResponse.ReportRuntimeError")
WriteToLog strRet
WriteToLog "Report Runtime Error BP Configured"
DbgState("BP_RUNTIME_ERROR_COUNT") = 0
WriteToLog "Current Breakpoint List(BL)"
Debugger.Write Debugger.Execute("bl")
End Sub
We added the following code to load the debugger extension and set the breakpoint. The last line will output the result of the !bpmd command to our log file for our rule.
WriteToLog Debugger.Execute(".loadby sos mscorwks")
strRet = Debugger.Execute("!bpmd System_Web_ni System.Web.HttpResponse.ReportRuntimeError")
WriteToLog strRet
WriteToLog "Report Runtime Error BP Configured"
Then we added the following we can use to keep track of a dump count for our breakpoint:
DbgState("BP_RUNTIME_ERROR_COUNT") = 0
This will set our breakpoint. When the breakpoint is actually hit, the Debugger_OnBreakpoint event is fired in our script. We will modify this function to handle our breakpoint and generate a full user dump file. We will also hard code a limit of 5 dump files.
To change the second function, look for Debugger_OnBreakpoint in the script file and re-configure it as follows:
Sub Debugger_OnBreakPoint(ByVal BreakPoint, ByVal CausingThread)
WriteToLog "Breakpoint at " & BreakPoint.OffsetExpression & " caused by " & CausingThread.SystemID
If BreakPoint.OffsetExpression = "System.Web.HttpResponse.ReportRuntimeError(System.Exception, Boolean, Boolean)" Then
If DbgState("BP_RUNTIME_ERROR_COUNT") < 5 Then
CreateDump Breakpoint.OffsetExpression, false
DbgState("BP_RUNTIME_ERROR_COUNT") = DbgState("BP_RUNTIME_ERROR_COUNT") + 1
End If
End If
End Sub
Save the script file.
Activate the Crash Rule and verify the breakpoint is set
Right click the rule in DebugDiag's rule view, and click the Activate Rule menu item. This will activate our rule. But how can we be sure our breakpoint was set? To do this go to the logs folder and open the w3wp__xxx_xxx.txt file that was created for the worker process when the rule was activated. The easiest way to get there is View->Logs Folder menu in DebugDiag. Locate the w3wp__PID__XXXX__Log.txt file for the PID of the currently running w3wp.exe and open it in notepad. Search for "Report Runtime Error BP Configured" in the log file, and make sure the breakpoint is correct. Here is what it should look like in the log file if it is correct:
Found 1 methods...
MethodDesc = 65f688bc
Setting breakpoint: bp 660A27C0 [System.Web.HttpResponse.ReportRuntimeError(System.Exception, Boolean, Boolean)]
[10/1/2009 1:22:10 PM] Report Runtime Error BP Configured
Conclusions
This post explains how to automate a managed breakpoint with DebugDiag to generate a Full User dump when the managed breakpoint is hit. The particular example used can be used to get a full user dump when the System.Web.HttpResponse.ReportRuntimeError function is called. Getting a full user dump when this function is called may help identify why a certain ASP.NET Runtime error occurs. For more information on how to analyze the dumps created please see the following .NET Debugging Demo's on Tess's blog:
https://blogs.msdn.com/tess/pages/net-debugging-demos-information-and-setup-instructions.aspx


